Understanding the Role of Biological Products in Corn Nitrogen Fertilization
July 8, 2024
TRIAL OBJECTIVE
- Biological products may offer environmentally friendly and sustainable solutions to enhance crop productivity, improve soil health, and manage pests and diseases. These products include beneficial bacteria, plant extracts, beneficial viruses, and other compounds.
- The objective of this trial was to test emerging biological products that enhance nitrogen uptake by corn plants, thereby decreasing the plants’ synthetic nitrogen fertilizer needs.
RESEARCH SITE DETAILS

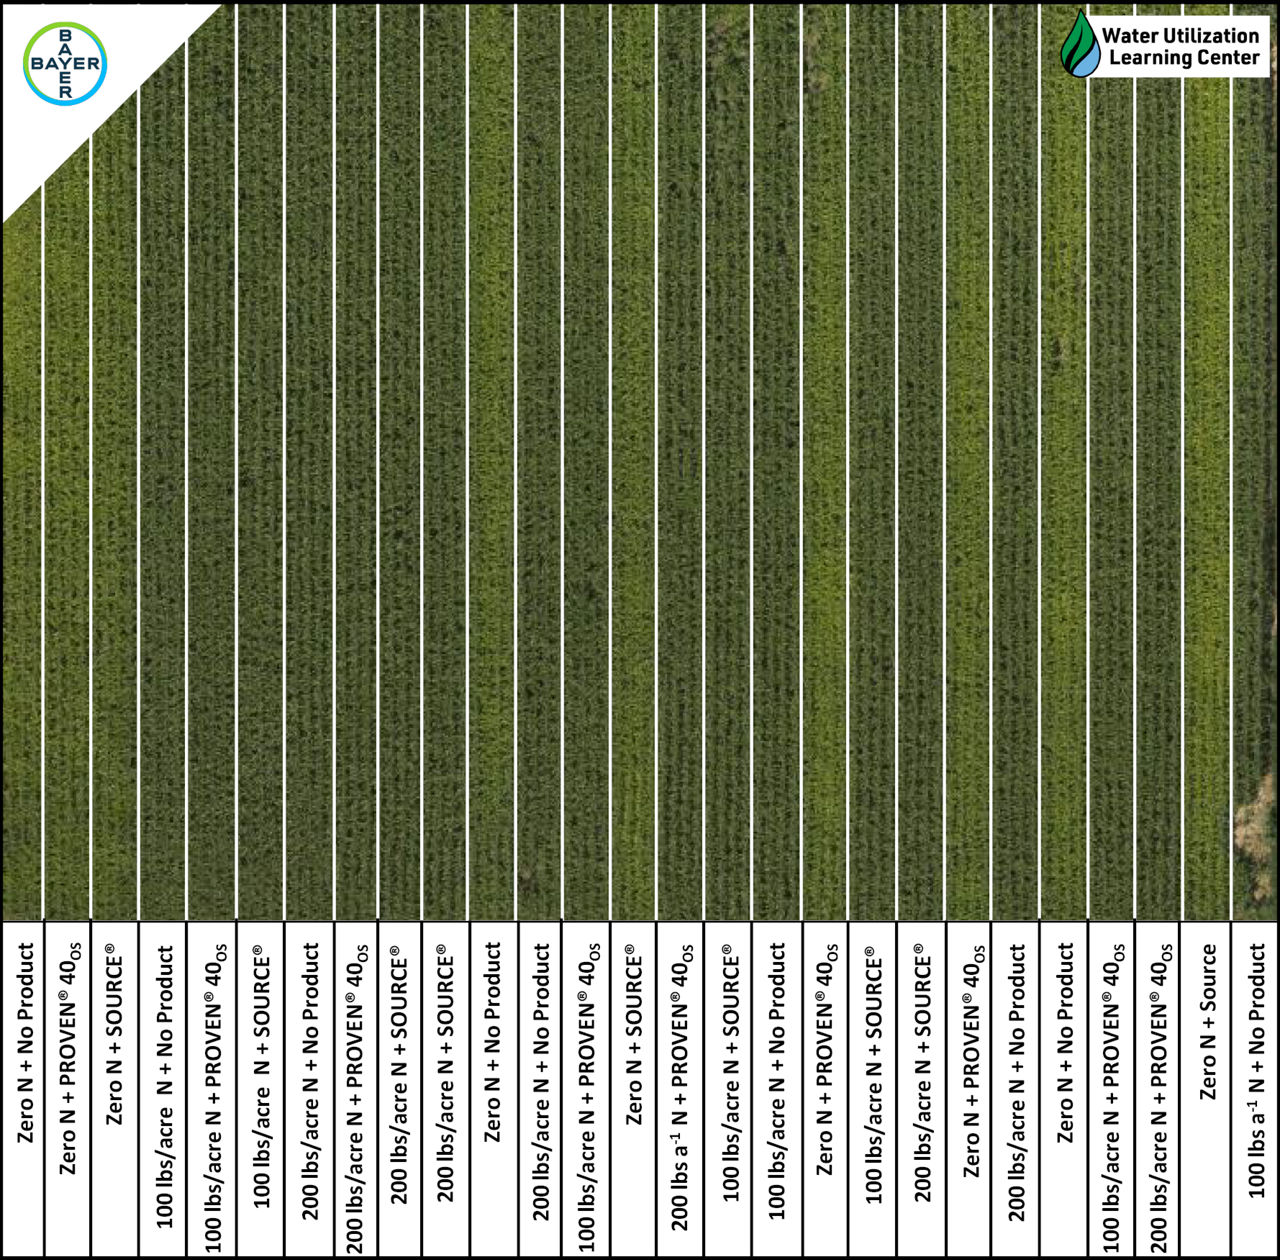
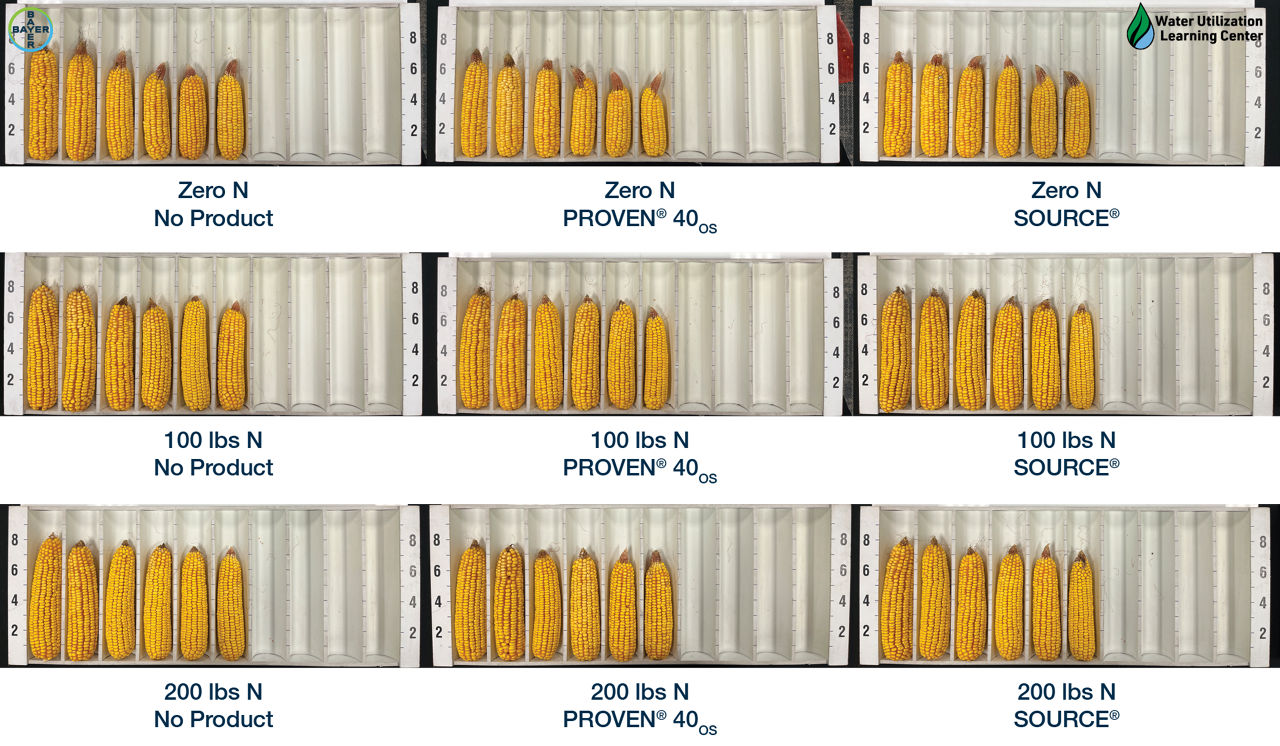
- The trial was arranged as a randomized complete block design with three replications and two treatment factors (Figure 1):
- Nitrogen Rates:
- 0 lb/acre
- 100 lb/acre
- 200 lb/acre
- Biological Nitrogen Products:
- no product
- Pivot Bio biological product PROVEN® 40 On-Seed (biological fertilizer seed treatment)
- Sound Agriculture biological product SOURCE® (soil activator)
- Nitrogen Rates:
- Soil was conventionally tilled with no base fertilizer application.
- On May 20, 2023, corn PRE herbicides were sprayed consisting of Roundup PowerMAX® 3 Herbicide (30 fl oz/acre), atrazine 4L (1 lb/acre), Harness® herbicide (32 fl oz/acre), Diflexx® herbicide (8 fl oz/acre), and Corvus® herbicide (5 fl oz/acre).
- 211-11SSPRIB brand corn (111 relative maturity) was planted on May 21, 2023, at a rate of 32,000 plants/acre into 190 ft by 10 ft strips.
- PROVEN® 40 On-Seed seed treatment was applied to seed according to the manufacturer's recommendation.
- On June 7, 2023, corn POST herbicides were applied consisting of Roundup PowerMAX® herbicide (32 fl oz/acre), atrazine 4L herbicide (1 lb/acre), Harness® herbicide (24 fl oz/acre), Laudis® herbicide (3 fl oz/acre), Diflexx® herbicide (16 fl oz/acre) with high surfactant oil concentrate (HSOC) (0.5%), Volt-Edge™ a VaporGrip Xtra Agent volatility reduction agent (VRA) (0.5%), and a drift reduction agent (DRA) (0.5%).
- Nitrogen fertilization was applied with Y-drop equipment at the previously described treatment rates on June 13, 2023, at approximately the V4 corn growth stage.
- SOURCE® soil activator was sprayed at 0.7 fl oz per acre in a 10 gal water mix when the crop reached the V10 corn growth stage.
- The total rainfall accumulated during the 2023 corn growing season was 12.63 inches. This trial was implemented in a linear irrigation system, and the total irrigation applied was 4 inches.
- Normalized Difference Vegetation Index (NDVI) was collected when corn reached V4 and V6 corn growth stages using a handheld sensor over the corn canopy.
- Corn stand counts and phytotoxicity ratings were collected on July 6, 2023.
- Drought and stay green ratings were collected close to harvest time.
- Total weight, test weight, and moisture content were collected with a plot combine on October 9, 2023, and yield per acre was calculated later. Corn yield components were collected from six random ears from each plot in one replication.
UNDERSTANDING THE RESULTS
Normalized Difference Vegetation Index (NDVI):

- The 0 lb/acre nitrogen application had a greater NDVI than the 100 and 200 lb/acre nitrogen (Figure 2).
- Average NDVI at the V4 corn growth stage was collected seven days after nitrogen fertilization, so corn biomass and plant health were likely unaffected by the added nitrogen at that time.

- There was no significant difference in average NDVI between PROVEN® 40 On-Seed and SOURCE® treatments, though both products significantly reduced NDVI readings at the V6 corn growth stage compared to no product (Figure 3).
- Average NDVI at the V6 corn growth stage was collected 14 days after nitrogen application, when the application rate treatments started to show differences in the corn canopy (Figure 3).
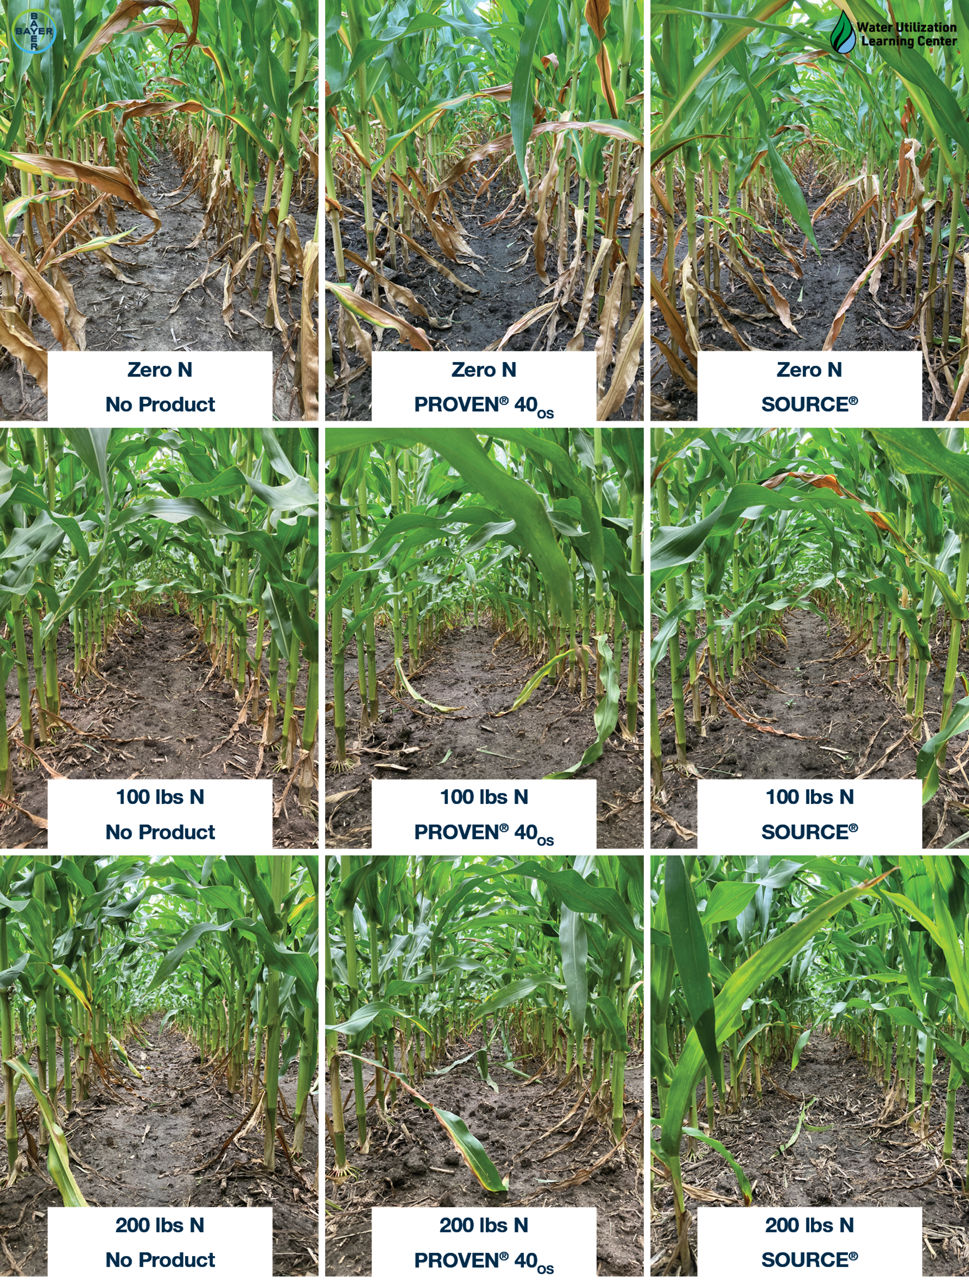
Corn Stands, Phytotoxicity, Drought, and Stay Green Ratings:
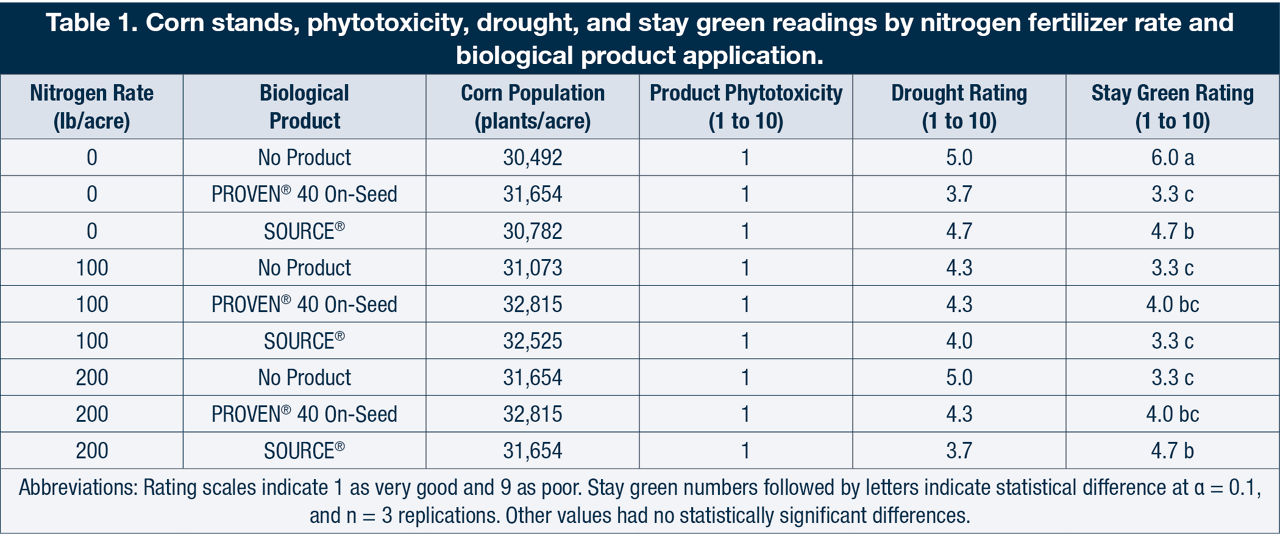
- No significant differences were found in average corn population, phytotoxicity, or drought ratings when comparing the nitrogen rates and the biological product applications (Table 1).
- When no nitrogen was aplied (0 lb/acre), corn treated with PROVEN® 40 On-Seed treatment had the best stay green rating, followed by corn treated with SOURCE® soil activator, and corn with no biological product applied had the worst stay green score.
- When 100 lb N/acre was applied, there was no significant difference in stay green score between the biological product applications.
- When 200 lb N/acre was applied, corn with no biological product had a significantly better stay green score than corn with SOURCE® soil activator.
Corn Grain Yield Components:
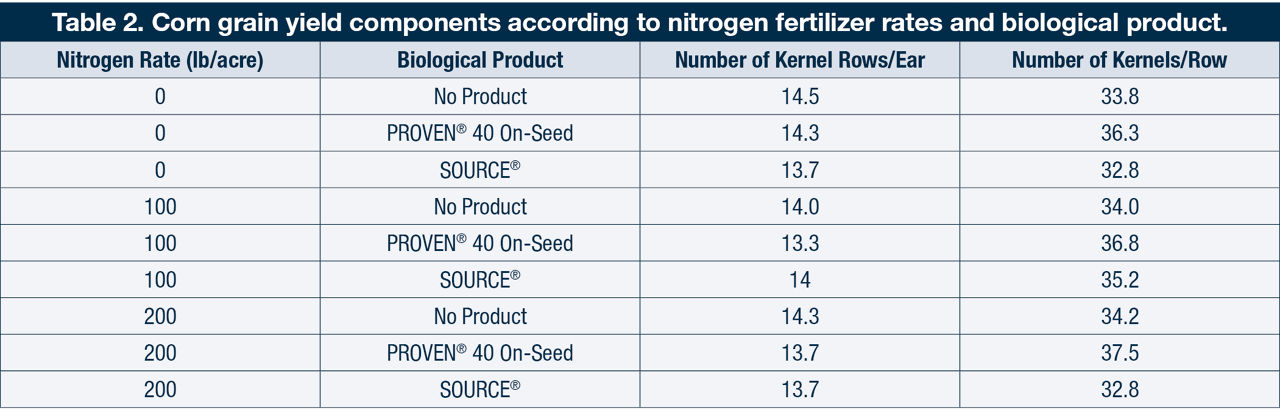
Corn Grain Yield:

- Despite the lack of response in NDVI ratings, there was a positive corn grain yield response when nitrogen fertilization was applied at rates of both 100 and 200 lb/acre compared to the 0 lb/acre nitrogen treatment.
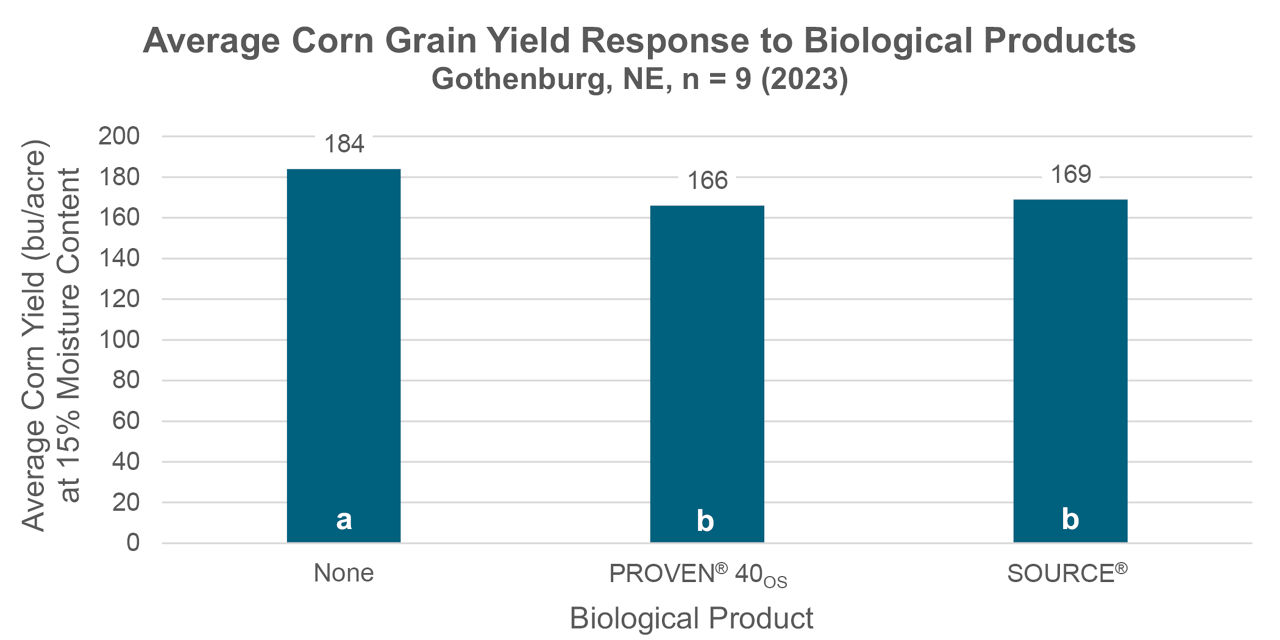
- Corn with PROVEN® 40 On-Seed seed treatment and SOURCE® soil activator had lower corn grain yields compared to corn with no biological product applied.
KEY LEARNINGS
- Both PROVEN® 40 On-Seed seed treatment and SOURCE® soil activator were not effective in increasing plant health, biomass, or corn grain yield.
- Applying nitrogen did increase yield. In this study corn yields decreased when either biological product was applied.
- Since they are live products, biologicals such as PROVEN® 40 On-Seed treatment and SOURCE® soil activator may respond to specific weather, management, and environmental conditions.
1213_383954