Antique Alley - A Walk Through Cotton of Yesterday and Today
April 24, 2024
FOREWORD
Modern cotton production has always been a dynamic undertaking. The changes producers have experienced since 1900 have impacted every area of crop management. Synthetic fertilizers, novel pesticides and biotech traits, higher yielding varieties with improved fiber quality, and innovative field equipment have helped producers increase productivity, efficiency, and profitability.
Cotton production must contend with several persistent pests. Potential and historical pests of cotton include thrips, lygus bugs, boll weevil, pink bollworm, tobacco budworms, cotton bollworms, European corn borer, whiteflies, aphids, and several others. Over the last 100 years, many of these pests have become insecticide resistant, necessitating the development of novel biotech traits to help maintain a sustainable cotton production system. Examples of these traits include Bollgard® cotton, Bollgard II® cotton, Bollgard® 3 cotton and ThryvOn® Technology along with the various herbicide resistance traits including Roundup Ready® technology, Roundup Ready® Flex technology and XtendFlex® technology offerings.
The insect control component of the system has seen radical changes in recent times. A program to eradicate the boll weevil from the Cotton Belt began in the late 1980s. That program has been very successful, and the mighty weevil has been eradicated from all but the most southern counties in Texas. In the mid-1980s, tobacco budworm (Chloridea virescens) was discovered to be resistant to pyrethroid insecticides in Texas. By 1987–88, resistant populations had spread to most of the mid-southern production areas and were continuing to move east. Tobacco budworm damage became a major limiting factor in cotton production, necessitating a shift to early (more determinate or less indeterminate) varieties to minimize the time the crop was in the field and thus susceptible to insect damage. In the late 1990s, Monsanto Company introduced Bollgard® cotton, the first of several biotech Bt traits for cotton production. This and subsequent traits proved to be highly resistant to both budworm (Chloridea virescens (Fabricius)), pink bollworm (Pectinophora gossypiella (Saunders)), and cotton bollworm (Helicoverpa zea (Boddie)) feeding. This trait technology helped reduce broad spectrum pesticide use, a change which often results in fewer aphid and spider mite outbreaks. The effects of insect-control products have become more powerful in recent times with the introduction of complimentary Bt traits and ThryvOn® Technology, which specifically target thrips and Lygus bugs. All of these factors have led to a cotton production system that is very different today than it was 30 years ago.
The combination of boll weevil eradication and Bt technology proved to be liberating for cotton producers, entomologists, and plant breeders. Modern cotton breeding focuses on generating high yielding, high quality cotton varieties integrated with trait technology and adapted for the many cotton producing regions of the United States. One incidental factor that has appeared as varietal development has progressed is a possible increase in indeterminacy, particularly when fruit shed is induced by environmental or pest-related influences. This change in growth habit has led to alterations in management including reduced seeding rates and more intensive plant growth management with plant growth regulator (PGR) applications, especially in growthy environments where vegetative and reproductive growth have the potential to become unbalanced.
The introduction of new biotech offerings requires cotton breeding to maintain improvements in fiber quality and yield potential while integrating new biotech traits into the latest germplasm. The influences of this combined effort have been manyfold including increasing yield potential, decreasing the potential for pest-related losses, and improving fiber quality. The cotton industry has discussed these changes for most of the modern production era. Questions included: What changed? Beltwide cotton yields are up, and quality is better than ever, but why? How do older genetics compare to newer products? What is the changing response to growth regulators? In response to these questions, the Scott Learning Center endeavored in 2023 to compare older (circa 1996) genetics to newer, more recent introductions from Deltapine®. This experiment was conducted with the primary goals of evaluating the growth, fruiting, fiber quality, and yield characteristics of two varietal cohorts from different eras of cotton production. This experiment also attempted to measure the potential influence of PGR use on varietal productivity by era of production. This report presents the results of that experiment. Thank you for reading along—it’s been fun.
ACKNOWLEDGEMENTS
This project was an almost accidental undertaking. This trial was originally planted to compare older genetics with the latest offerings from Deltapine®. Ultimately, it has taken on a life of its own and hopefully this can help supply some insight into how cotton has changed over time. A simple request to help grow non-traited seed led to acquisition of seed sources allowing the comparisons to be made. We would like to thank and acknowledge everyone involved in the process. It was quite an effort. Trait Pipeline Discovery personnel at the Scott site supplied seed, ginned and delinted samples, and put up with almost constant questions. Local Market Development Technical Agronomists helped in coordinating tags for ginning and processing of samples. The Bayer Seed Quality Analytical Lab in Ankeny, Iowa quickly analyzed oil seed content samples from the study. Several reviewers helped to get content into a digestible form. The Knowledge Transfer team helped greatly in getting the report done in a timely manner. And, as usual, the Scott Learning Center staff supported the idea all summer and fall. The SLC staff also made many special arrangements to successfully accomplish the goals including managing the plot area using conventional insecticides and herbicides, positionally mapping more plots and plants than ever and generally solving the problems associated with this type of work. All data presented in this report were collected, compiled and analyzed at the Scott Learning Center during the summer and fall of 2023 by the Learning Center Staff. SLC staff members included Harrison Burford, Brent Blocker, Tristian Stigall and Jay Mahaffey. This report is truly a compilation of the efforts by everyone involved. A sincere THANK YOU to everyone involved!!!
ABSTRACT
During the summer of 2023, seven vintage cotton varieties—average plant variety protection (PVP) date of 1996—were compared to seven recent introductions (average PVP/patent year of 2020) from Deltapine®. Fruiting profile, plant growth regulator response, fiber quality, and yield potential were all compared in a side-by-side production system. Nodes of the 95% zone, height, node numbers, and fiber loan values were measured to be statistically similar across all treatments. System-wide yield potential was measured to have increased significantly from 1142 lb/acre (OLD-UTC PGR) to 1921 lb/acre (NEW-AGG PGR). This is likely due to the combination of genetic gain and PGR use. Lint percent was measured to have increased significantly from 36.6% (OLD-UTC) to 41.4% (NEW-AGG). The probability of setting a harvestable first-position sympodial boll (nodes 18 and below) was measured to have increased significantly from 30.3% (OLD-UTC PGR) to 51.3% (NEW-AGG PGR). Gross revenue per acre (using yield, lint percent, and loan value) increased from $632.76 per acre (OLD-UTC PGR) to $1071.16 per acre (NEW-AGG PGR). This is an increase in potential gross income/acre of $438.40 (69.2%) per acre when comparing NEW-AGG PGR to OLD-UTC managed fields.
MATERIALS AND METHODS
During 2023, seven old (OLD) and seven new (NEW) cotton varieties were planted at the Bayer Learning Center at Scott, Mississippi. Seed from OLD varieties was produced from pure seed sources during 2022. OLD varieties were non-Bt and protected from Lepidopteran pests with conventional pesticide applications.
Field Establishment
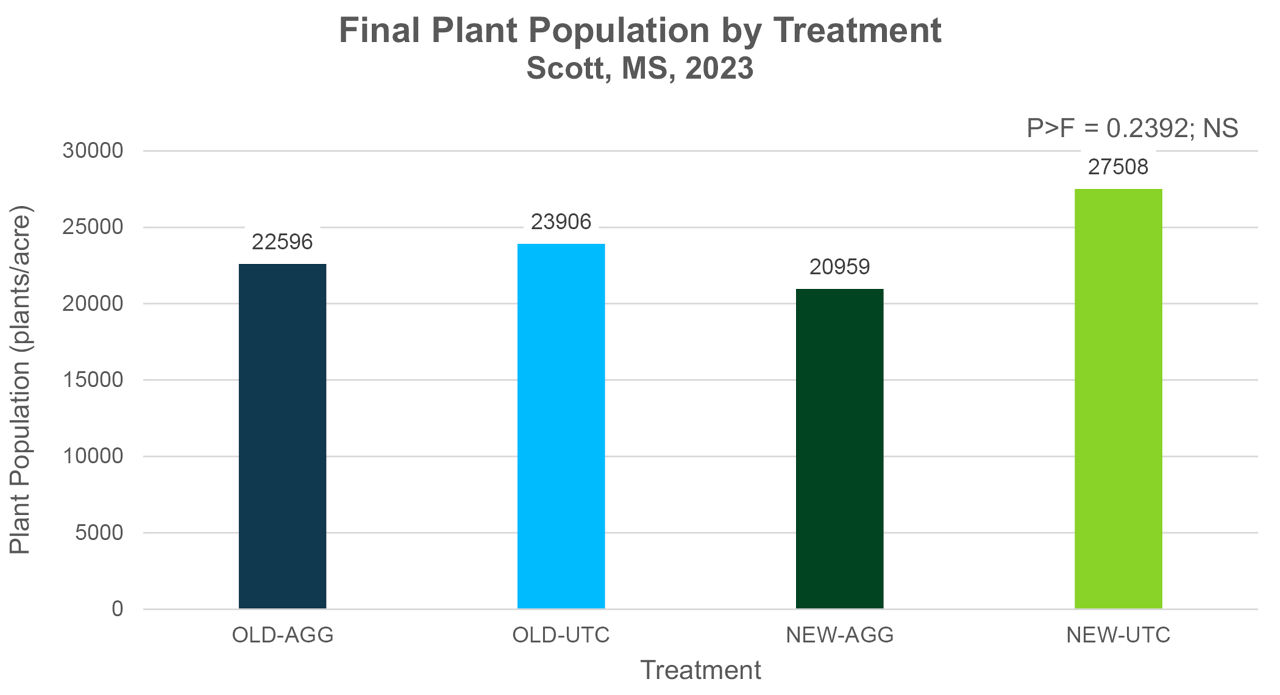
Plants were established on a Commerce silt loam soil in the field referred to as the Heaven Cut. Seeding rate was 42,000 seeds per acre and seeds were planted on 38-inch-wide bedded rows. Final stand establishment was statistically similar for both OLD and NEW and across the experiment averaged 56.5% of planted or 23,742 plants per acre. The planting date for all plots was May 4, 2023. Fertility treatments applied included previous crop replacement phosphorus and potassium (based on grid sampling/soil test) and 120 lb nitrogen surface applied as 30-0-0-2.5.
A note on seeding rate in this study—the seeding rate used across the study was 42,000 seeds per acre. However, cotton production in the Midsouth during the time represented by the OLD era typically used seeding rates around 45,000 seeds per acre, and NEW era seeding rates were typically 40,000 seeds/acre. This may be a factor to consider when interpreting agronomic results across the production eras.
Varieties planted included the following cohorts:
- OLD – Average PVP Year of 1996
- Sure-Grow 125
- Deltapine® 393
- Sure-Grow 501
- Deltapine® 5415
- DeltaOpal
- Deltapine® 499
- Deltapine® 6166
- NEW – Average PVP/Patent Year of 2020, Deltapine® cotton varieties
- DP 2115 B3XF
- DP 2012 B3XF
- DP 2328 B3TXF
- DP 2333 B3XF
- DP 2127 B3XF
- DP 2038 B3XF
- DP 1646 B2XF
Two different plant growth regulator (PGR) regimes were imposed using 4.2% mepiquat chloride on the following dates and rate combinations:
- Untreated (UTC) – no PGR applied
- Aggressively managed plot (AGG)
- 16 ounces/acre at 12 nodes on 6/25/2023
- 16 ounces/acre at 17 nodes on 7/9/2023
- 16 ounces/acre at 20 nodes on 7/20/2023
An important node about the PGR applications—the SLC experienced several weather days in making these applications. For this reason, the AGG treatment is not the most aggressive system that could have been implemented. This PGR management should be regarded as adequate, but not excessive.
All insect pests were controlled using labeled rates of appropriate crop protection products. This included thrips, lygus, and Heliothine species. Treatments were triggered for the entire plot using sampling and university thresholds on the conventional (i.e. non-transgenic) cotton varieties in the trial. One application was required for Heliothine pests and four applications for lygus species. We attempted to remove insect damage as a confounding factor in the study.
All plots were chemically defoliated using a Finish® 6 PRO harvest aid defoliant-based, two-pass system at recommended rates and timings prior to plant collection and machine harvest.
Positional Mapping Detail
After defoliation and boll opening were complete, plants from 6 row feet of each plot were cut, bundled and moved to the designated plant mapping area.
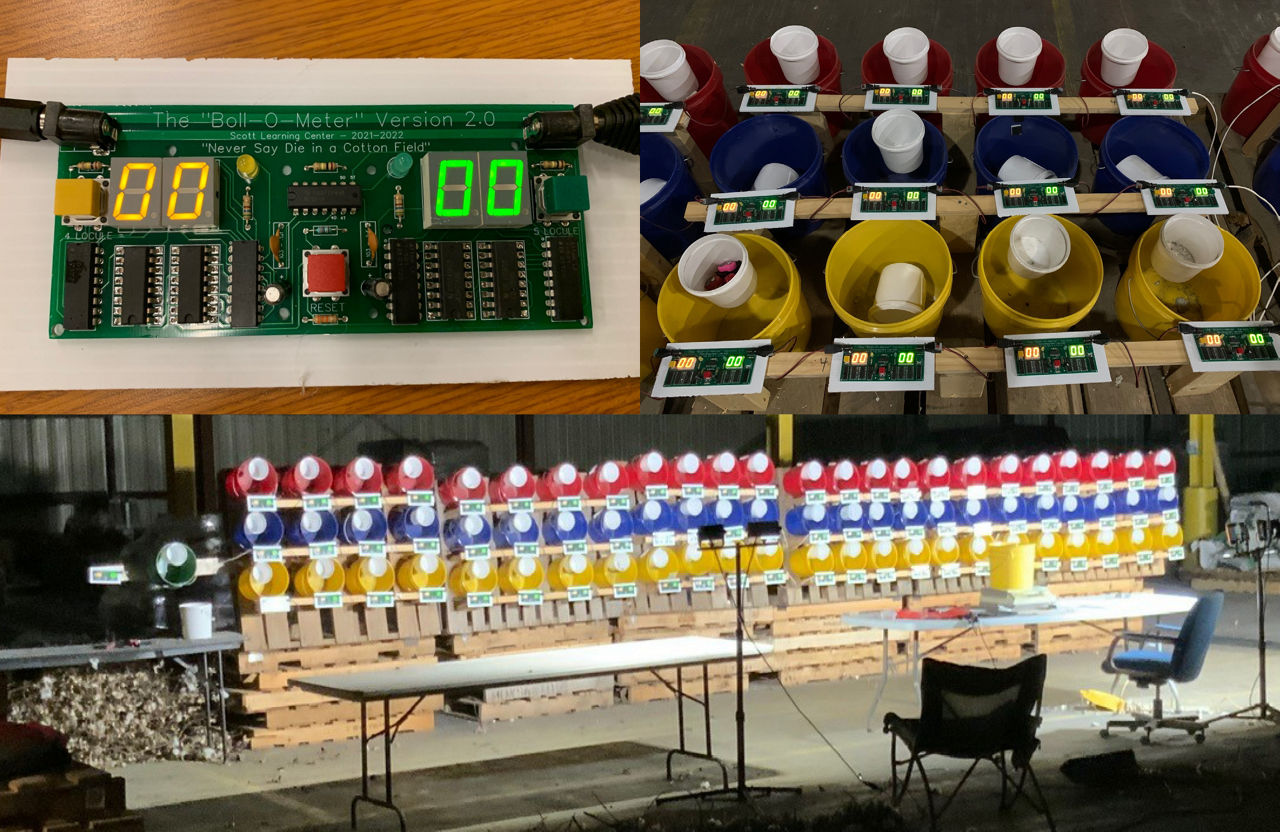
- All fruiting forms were positionally mapped using the Boll-O-Meter (Figure 1) which has been developed at Scott over the last two seasons.
- Damaged plants were mapped to the point of damage. An important point—very few damaged plants were present in the trial and are not likely to significantly impact the distributions recorded in the data.
- Fruiting forms from damaged plants and branches were considered vegetative and added to that cohort.
- Four individual seed cotton samples were generated from each mapped sample including the following:
- Monopodial Bolls
- First Position Sympodial Bolls
- Second Position Sympodial Bolls
- Third Position Sympodial Bolls
- Raw samples were weighed for estimations of seed cotton yield by individual fruiting position.
- After mapping and weighing, the four cohorts were individually bagged for ginning.
- Post ginning estimations were made for the following parameters:
- Seed cotton per acre
- Lint per acre
- Lint per fruiting position cohort
- Lint percent by boll cohort
- HVI performed on each individual boll cohort for each sample.
- Seed cotton per acre, lint percent, and HVI fiber data were used with the 2023 Loan Price Chart (USDA 2023) to establish fiber value for each cohort. Reported loan values are weighted averages of the various parameters.
- From the above data gross returns ($/acre, $/position, etc.) were tabulated/evaluated for the various parameters.
Data Analysis
- Data were analyzed using JMP (SAS Institute) in the following manner:
- Four ERA-PGR Cohorts were defined as follows. These designations will be used through the remainder of the report.
- OLD-UTC: 1996 era varieties with no PGR applied
- OLD-AGG: 1996 era varieties with three PGR applications as described above
- NEW-UTC: 2020 era varieties with no PGR applied
- NEW-AGG: 2020 era varieties with three PGR application as described above
- For analysis variety was held as replication, n=7
- Standard Least Squares Mean ANOVA performed.
- Means separated using Fisher’s protected LSD where main effect probabilities were < 0.05.
RESULTS
1. General Agronomic Discussion, Part 1
The AGG plant growth regulator treatment applied to varieties tested in this trial should be viewed as adequate, but not exceedingly aggressive. However, it would almost certainly be viewed as more aggressive than PGR management would have been in the mid-1990’s. It would also be characterized as adequate for both varietal cohorts in the production system of 2023.
- Established Plant Population per Acre – Statistically similar populations were established across the various ERA-PGR combinations. Established populations were approximately 56.5% of the seeding rate planted.
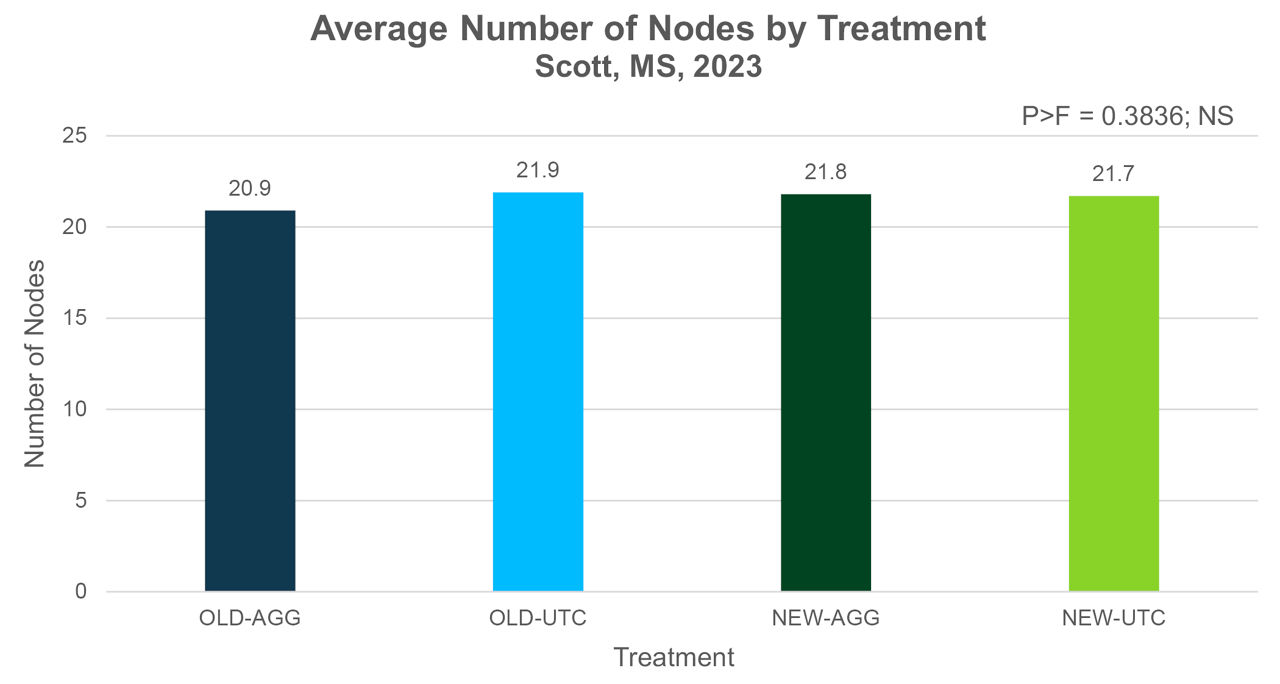
- Mainstem Node Numbers – Statistically similar numbers of mainstem nodes were generated across the various ERA-PGR combinations.
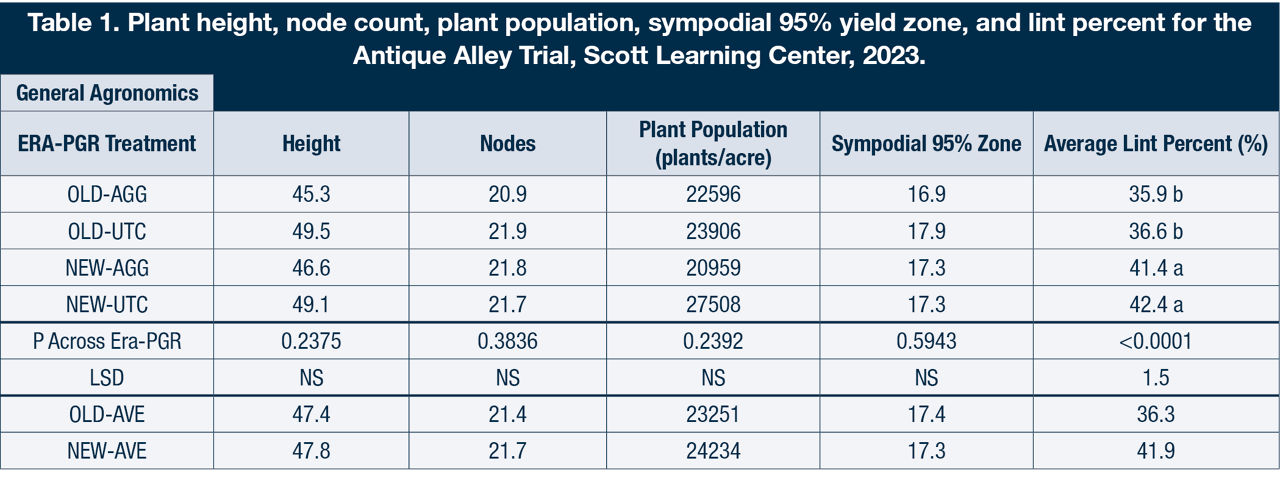
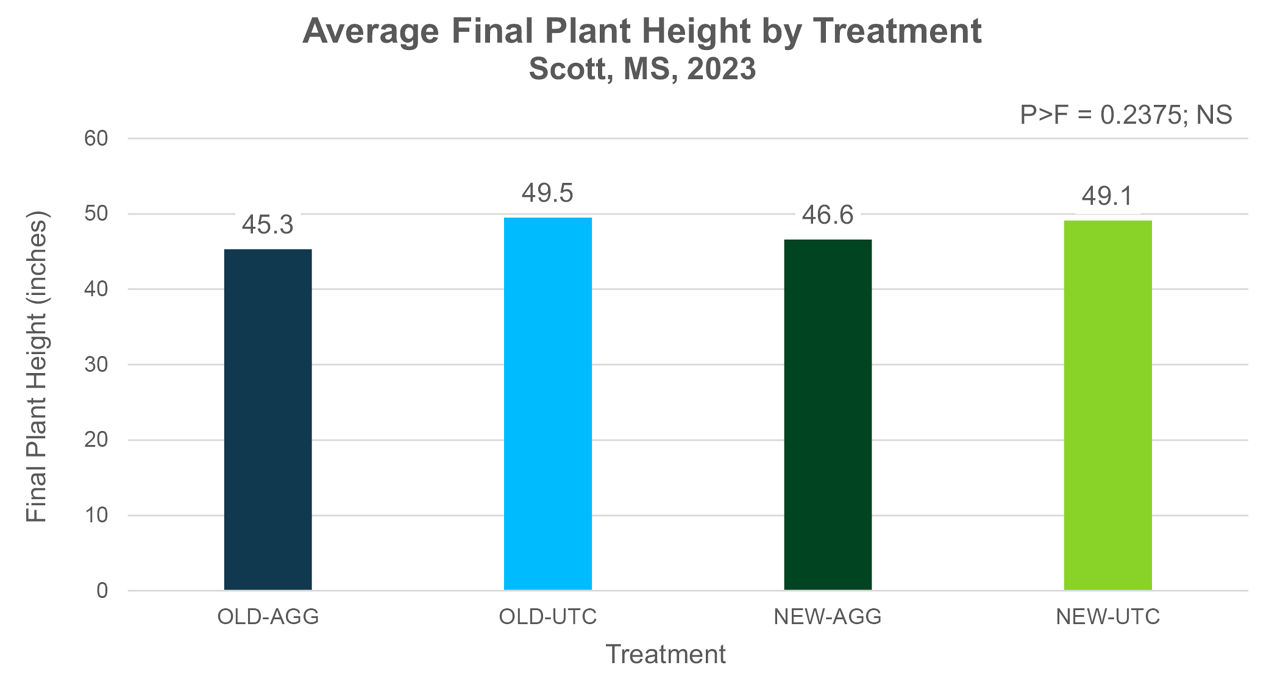
- Final Plant Height – Statistically similar plant heights were recorded across the ERA-PGR combinations in the trial. This is an important realization in that, while PGR did have significant yield impacts (discussed below), heights were not significantly impacted by the applications. Previous Learning Center work has shown the optimal cotton plant height to be 48 to 50 inches and, on average, most plants in this trial were in that range.
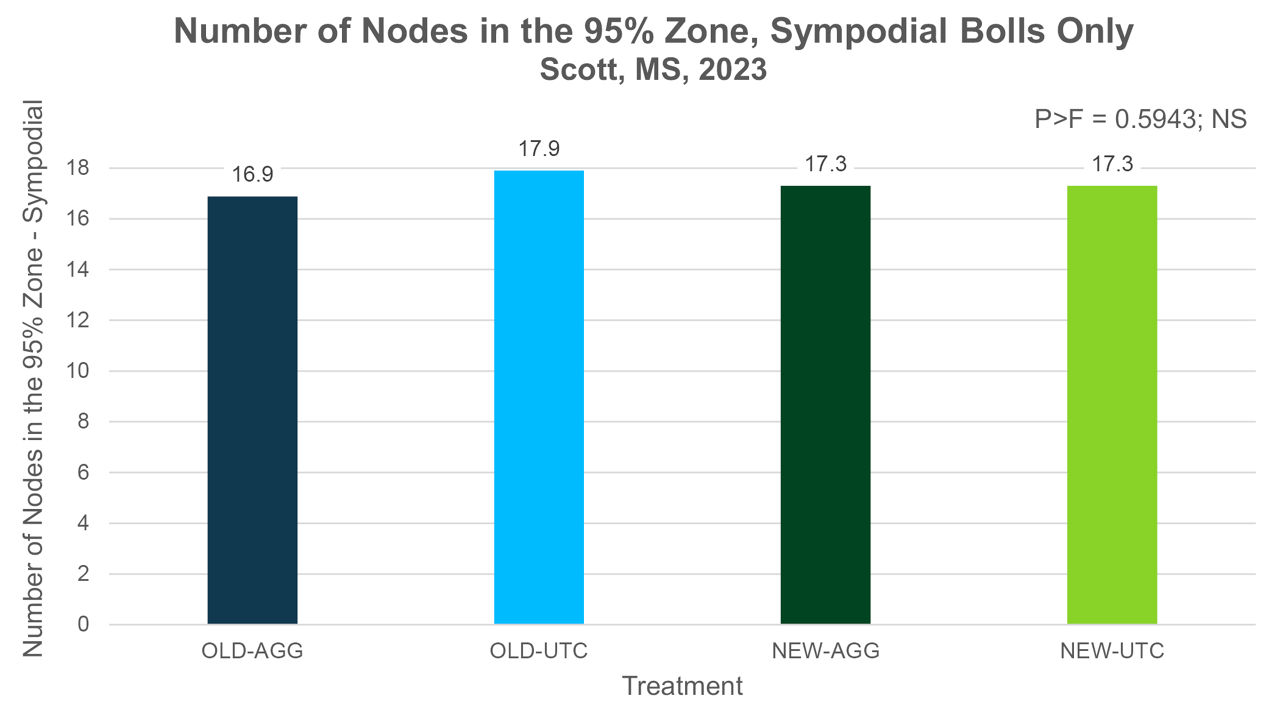
- Sympodial 95% Yield Zone – The sympodial 95% Zone is defined as the zone that generates 95% of the harvestable yield from sympodial fruiting forms. No significant differences were recorded across this study. Neither PGR application nor varietal ERA altered this component of the cotton growth pattern.
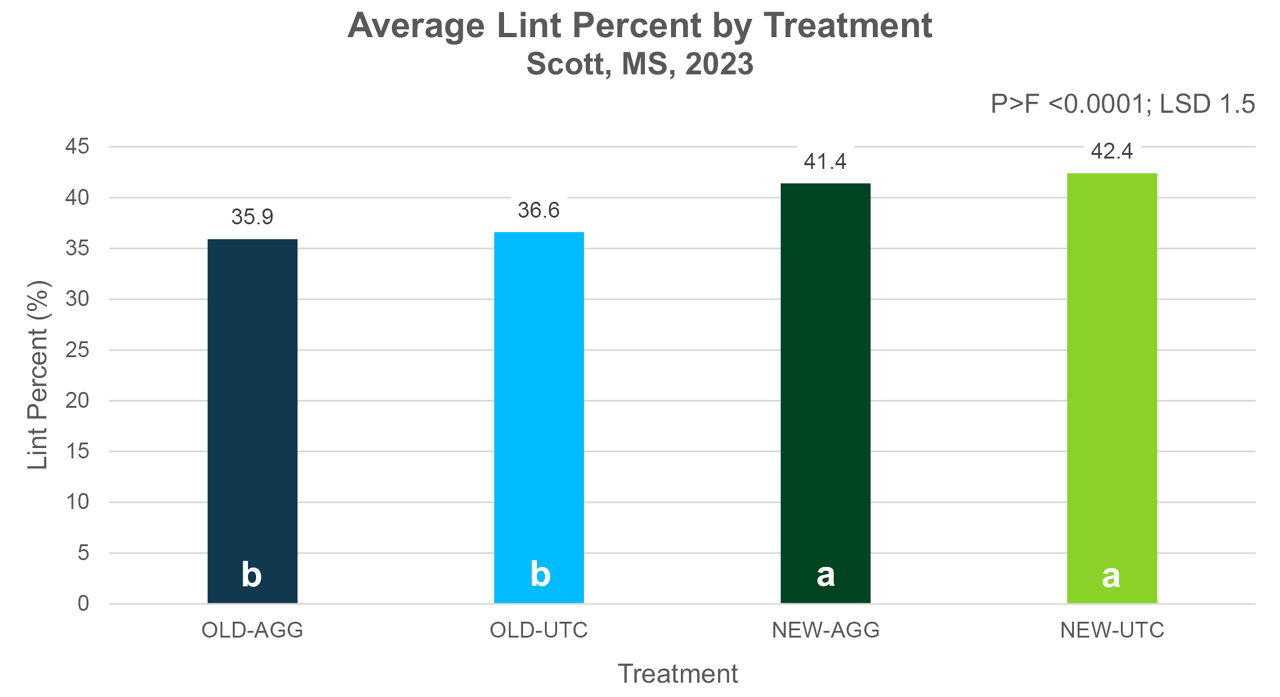
- Lint Percent – The lint percent measured across the trial indicated statistically significant change, particularly across the varietal ERAs. Lint percent was measured to have increased significantly by an average of 5.6% in the NEW variety cohorts.
2. General Agronomic Discussion, Part 2
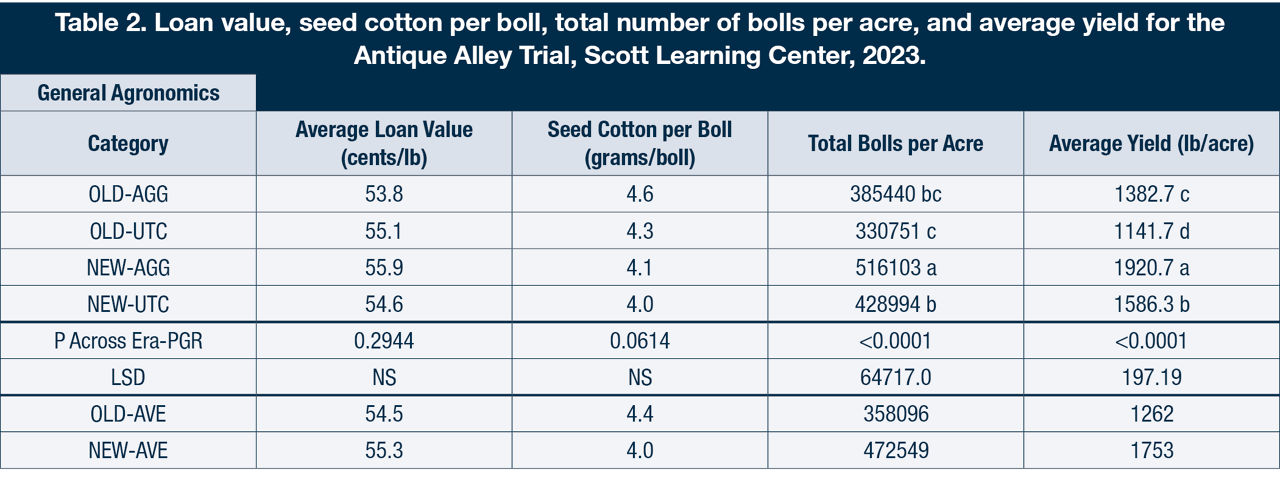
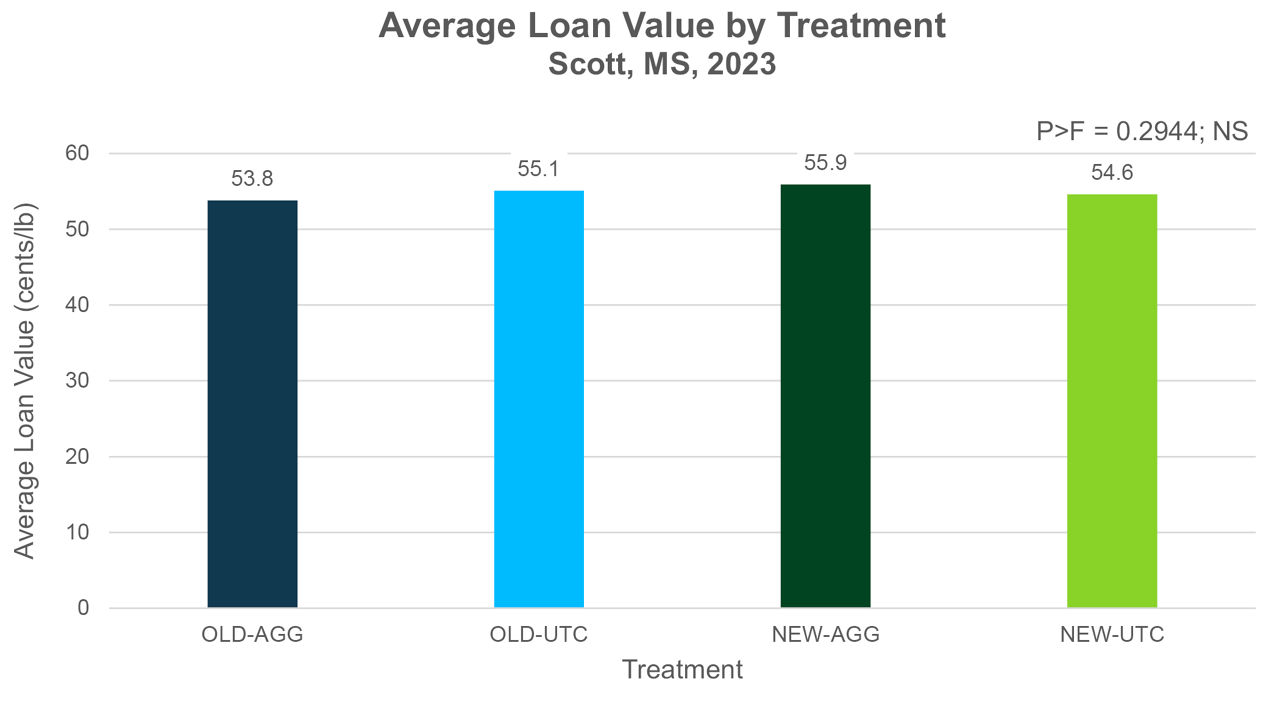
- Loan value – As measured by the loan chart established fiber value. Fiber value in cents per pound did not change significantly due to any of the experimental factors.
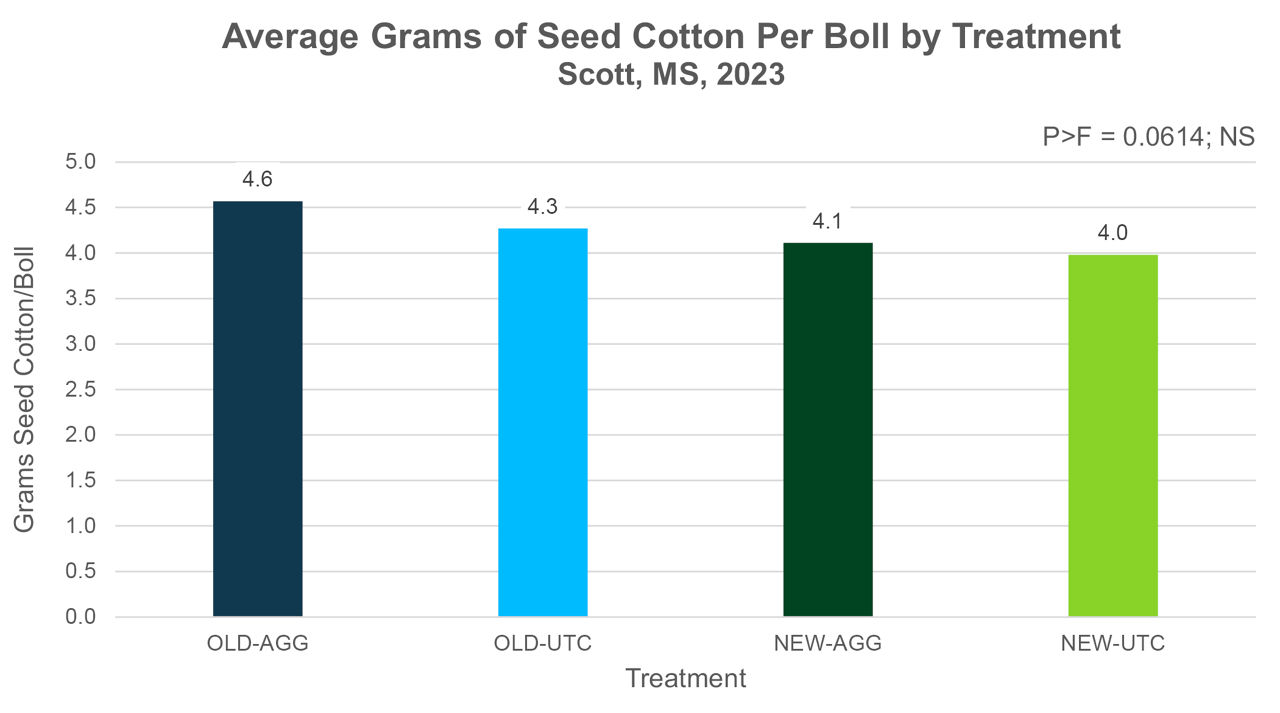
- Boll size – No significant change in boll size was measured in the study. Previous work has indicated PGR to generally increase boll size and potential changes were just outside the range of statistical significance in this case (p=0.0614).
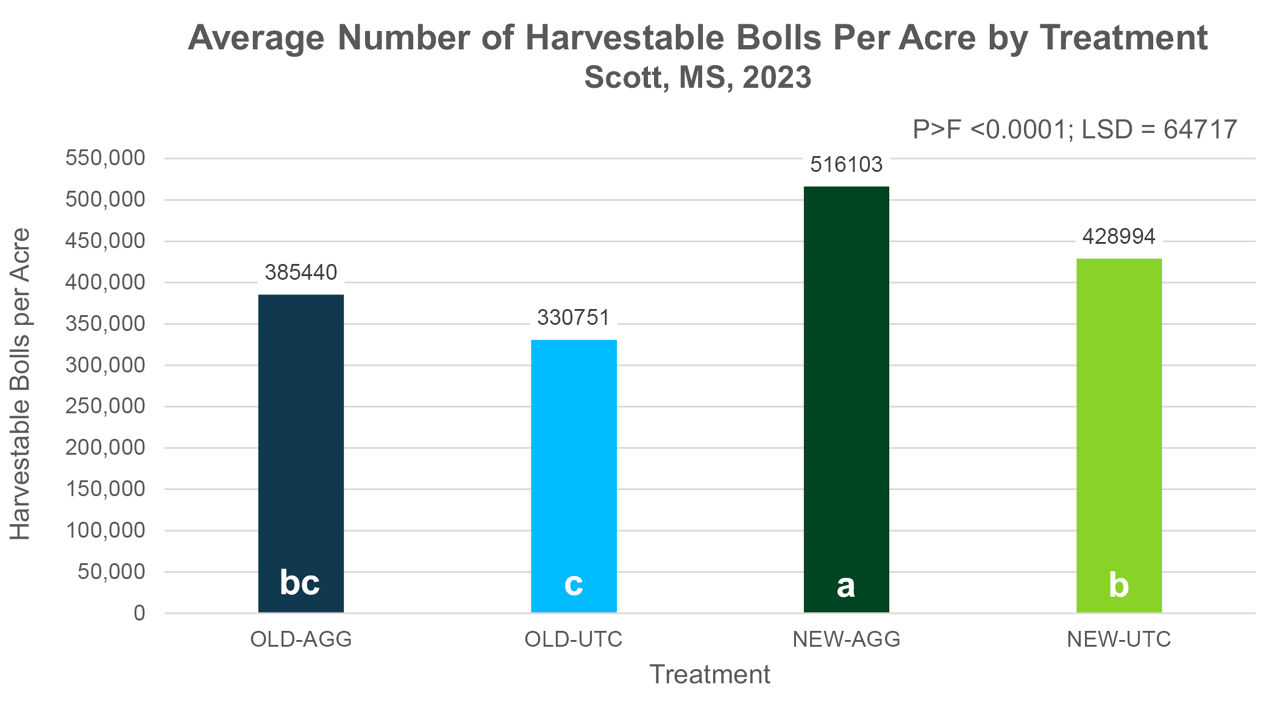
- Total harvestable bolls per acre – Significant increases in number of harvestable bolls per acre were recorded in the study. The NEW-AGG treatment produced significantly greater numbers of harvestable bolls than any of the other treatments, while the OLD treatments produced generally fewer harvestable bolls than NEW. PGR also had a significantly greater impact on harvestable boll number in the NEW varieties than the OLD. This could lead to increases in the number of seeds per acre, which has been shown to be a primary contributing factor in modern yield increases across other work.
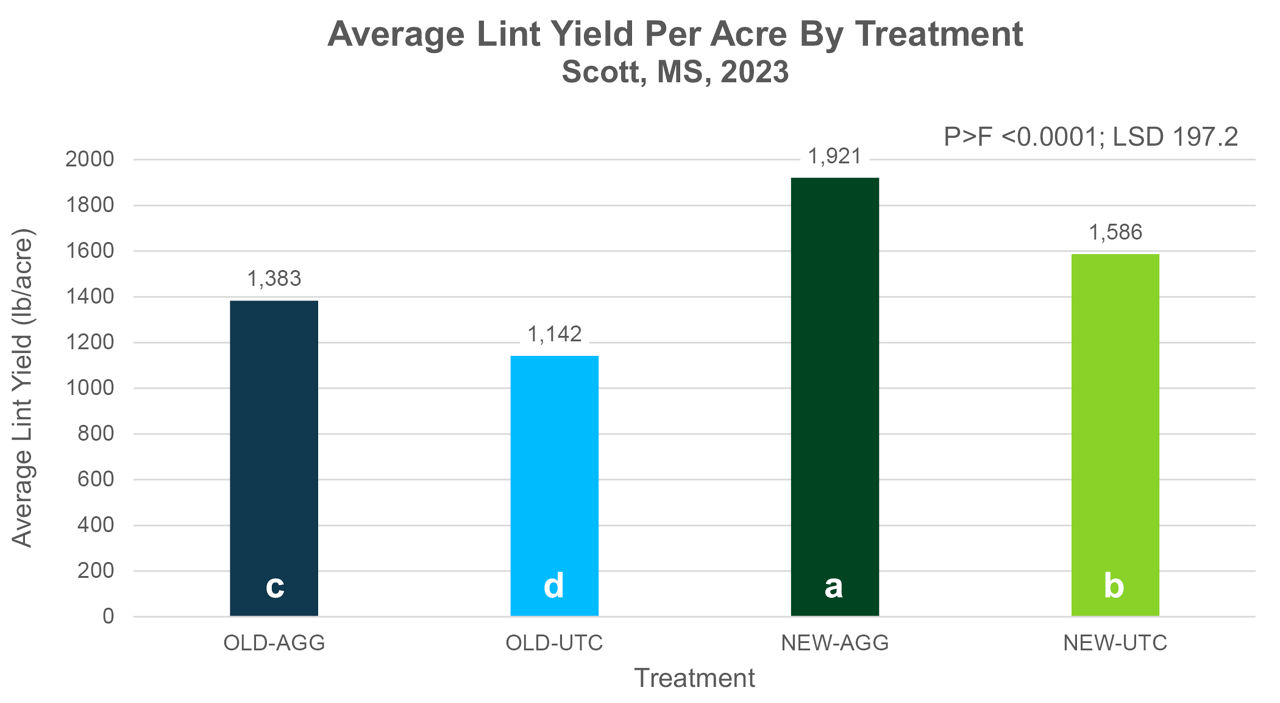
- Yield (lb lint/acre) – Significant differences in lint produced per acre were observed in the study with the NEW-AGG treatment demonstrating the highest overall yield potential and the OLD-UTC treatment having the lowest overall potential. Significant yield improvements were observed in both OLD and NEW varieties from PGR use. PGR also appeared to have a somewhat greater impact (334 lb/acre versus 241 lb/acre) on the NEW varieties versus the OLD, respectively.
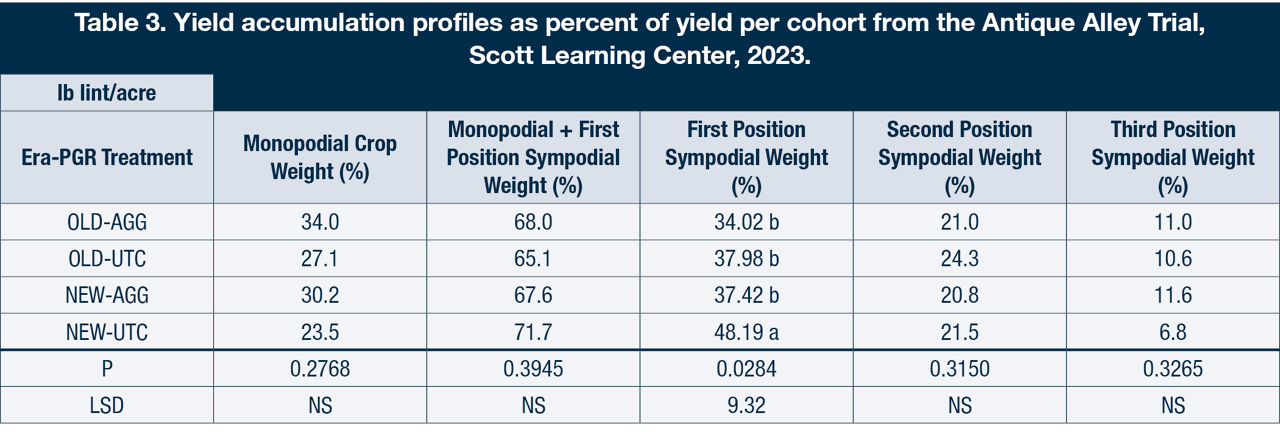
3. Yield Accumulation Profiles – Percent of the Crop by Positional Cohort
Whole plant yield profiles have changed in cotton over the production eras, primarily due to several factors represented in this study. In modern times growers typically plant lower seeding rates, which leads to relatively larger proportions of the crop being generated on monopodial positions compared to historical varieties. These data represent the percent of the crop fiber weight in the various cohorts.
Study Observations:
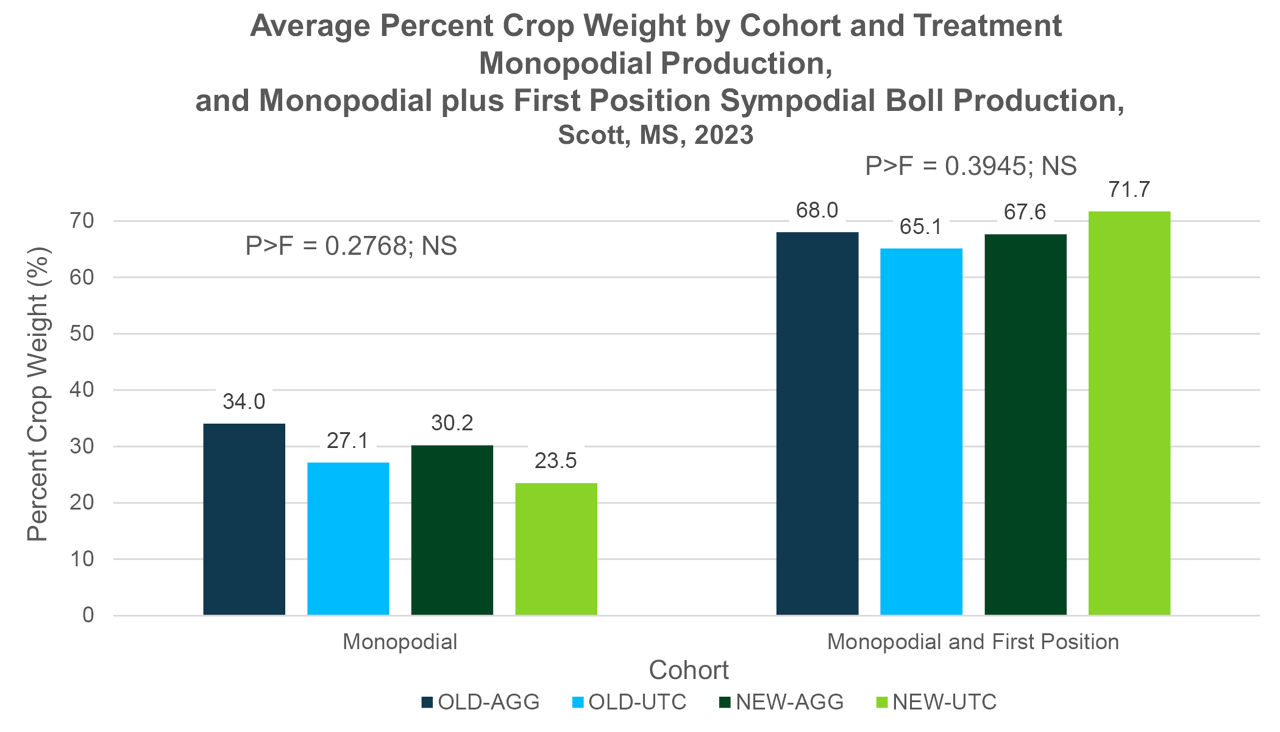
- Percent Crop Weight from Monopodial Positions – Across all ERA-PGR combinations an average of 28.7% of the crop was produced on monopodial branches. No significant differences in monopodial accumulation were recorded across the ERA-PGR combinations.
- Percent Crop Weight from Monopodial and First Position Sympodial Bolls – For purposes of analysis, monopodial bolls and first position sympodial bolls were grouped into a cohort. This is primarily due to the likelihood that they are likely bolls of a similar age, although that assumption remains under investigation. No significant differences in yield accumulation were recorded when data was categorized in this manner.
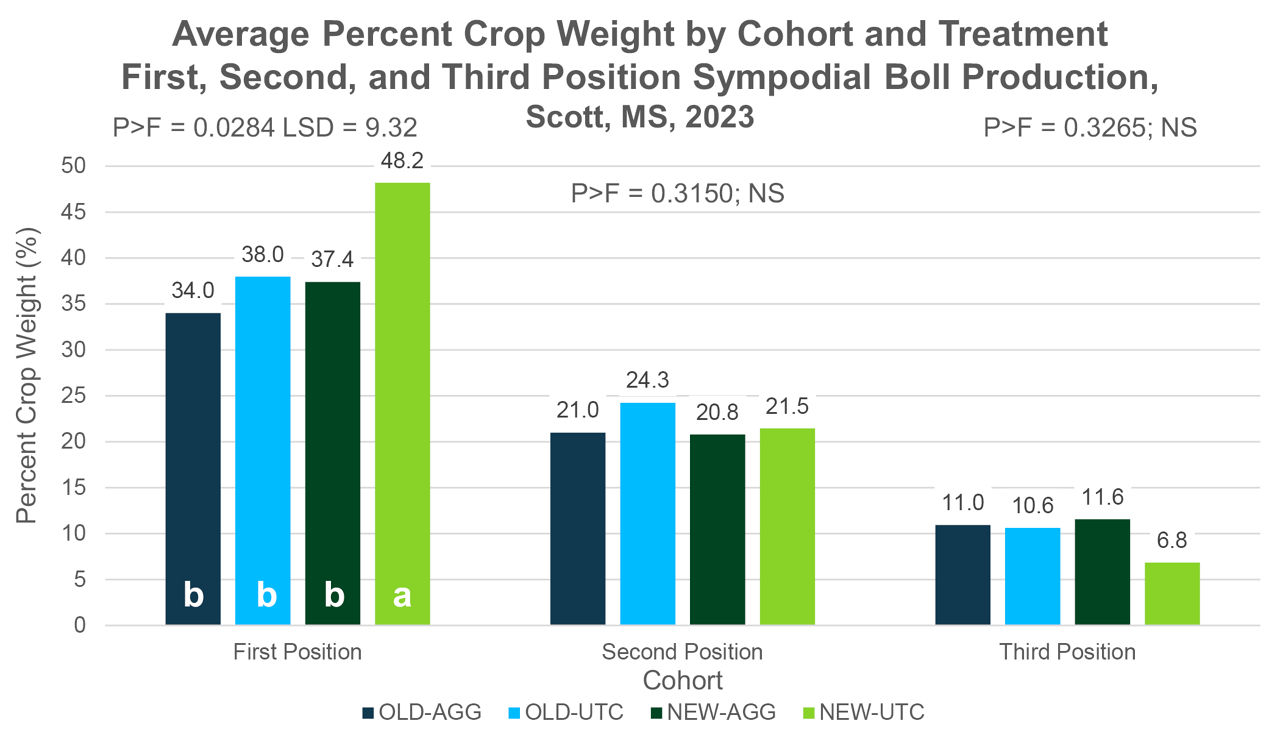
- Percent Weight from First Position Sympodial Bolls – The NEW-UTC treatments demonstrated production of a higher percentage of the crop on these positions. This difference was marginally significant and could be mostly noise. However, it could be explained in that, as NEW varieties are aggressively managed, they transfer a greater percentage of the crop from first position sympodial bolls to monopodial, second sympodial, and third sympodial positions.
- No significant differences in yield accumulation were measured in the percentage of the crop produced from second and third position sympodial fruiting.
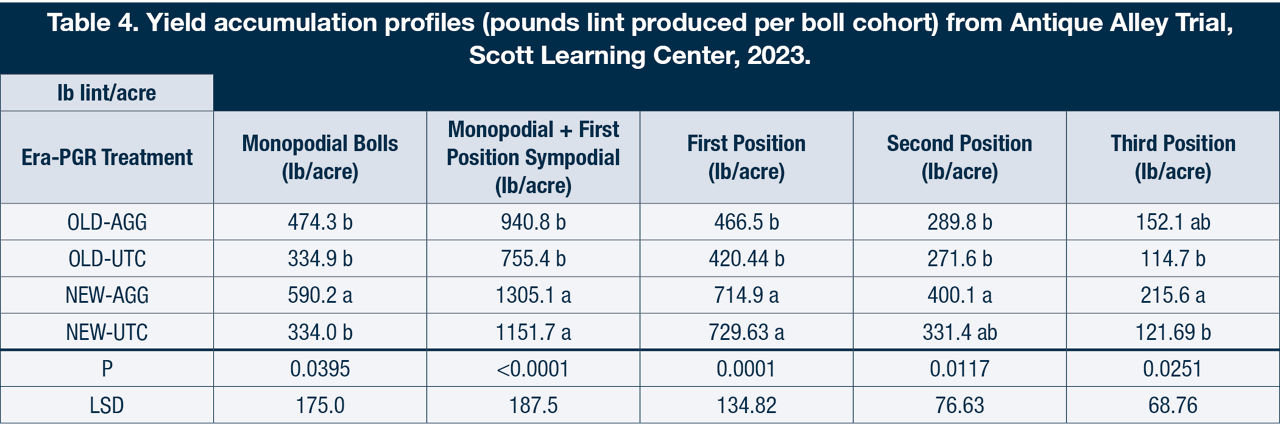
4. Lint Yield by Cohort – Pounds Produced per Acre by Positional Cohort
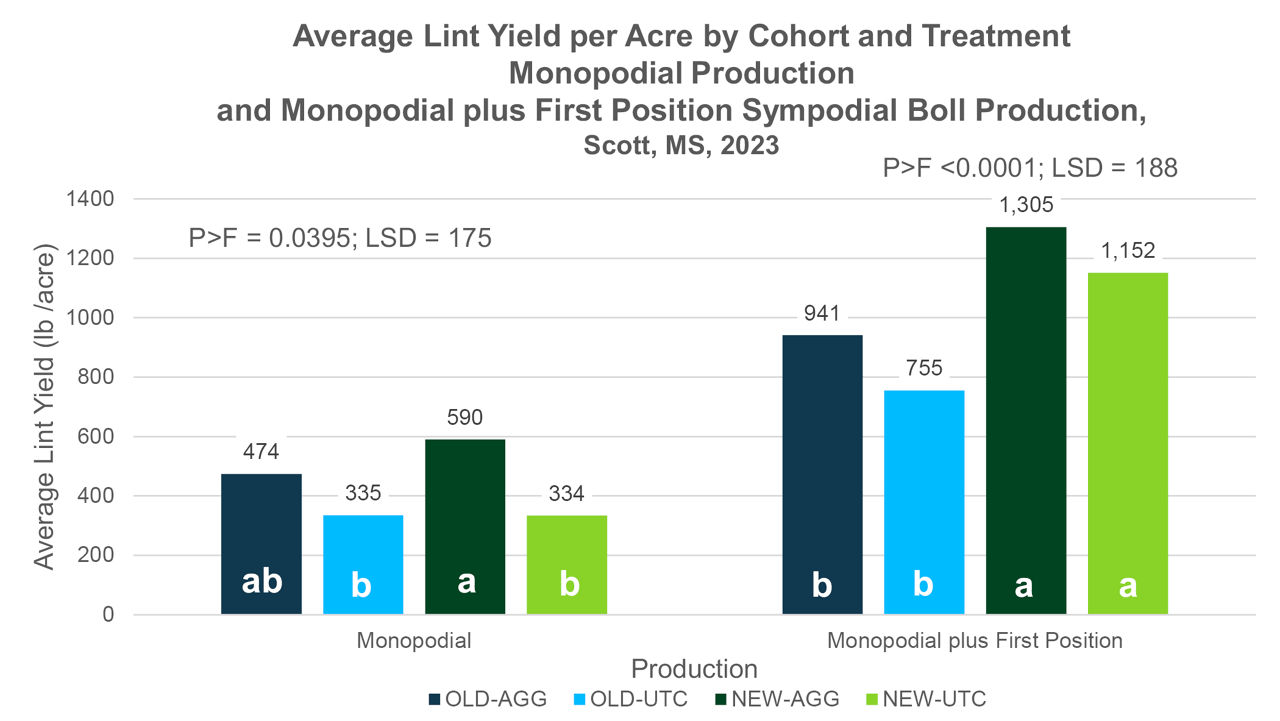
- Pounds of Lint per Acre from Monopodial Fruiting – No differences were observed in the amount of lint produced from monopodial positions regardless of ERA or PGR treatment.
- Pounds of Lint per Acre from Monopodial plus First Position Sympodial Fruiting – When considering the cohort of monopodial positions and first position sympodial fruit, the NEW-AGG cohort produced the highest contribution and was statistically similar to the NEW-UTC cohort. Both OLD cohorts were statistically similar to one another and generally produced a lower contribution than the NEW cohorts.
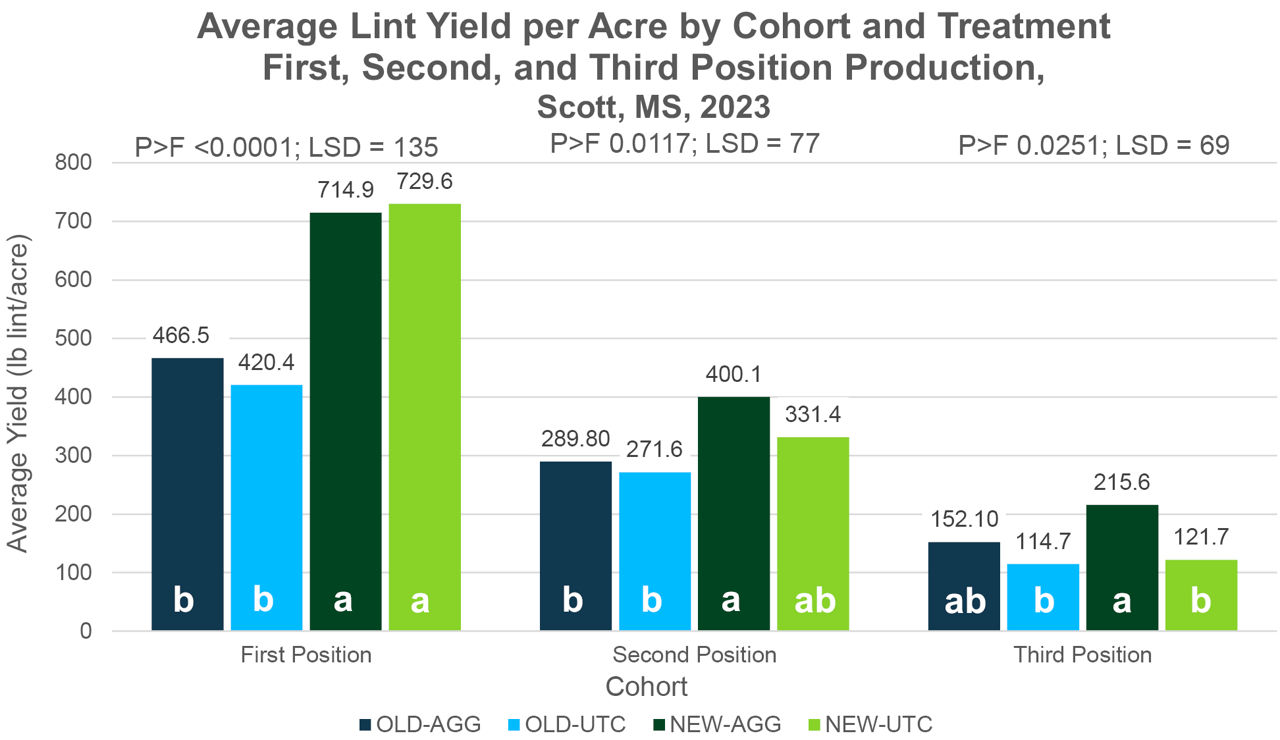
- Pounds of Lint per Acre from First Position Sympodial Fruiting – The NEW cohorts produced a similar lint contribution, and that contribution was statistically larger than either of the OLD cohorts.
- Pounds of Lint per Acre from Second Position Sympodial Fruiting – The NEW-AGG cohort produced significantly more lint per acre on these positions than either of the OLD treatments. The NEW-AGG and NEW-UTC produced statistically similar lint per acre from these positions.
- Pound of Lint per Acre from Third Position Sympodial Fruiting – The NEW-AGG cohort produced the largest crop from third position sympodial fruiting and that contribution was similar to the third position sympodial contribution of the OLD-AGG cohort. This implies that PGR use can, and likely does, have a general influence in the ability of plants to support third (and likely second) position sympodial fruiting forms, particularly in NEW varieties.
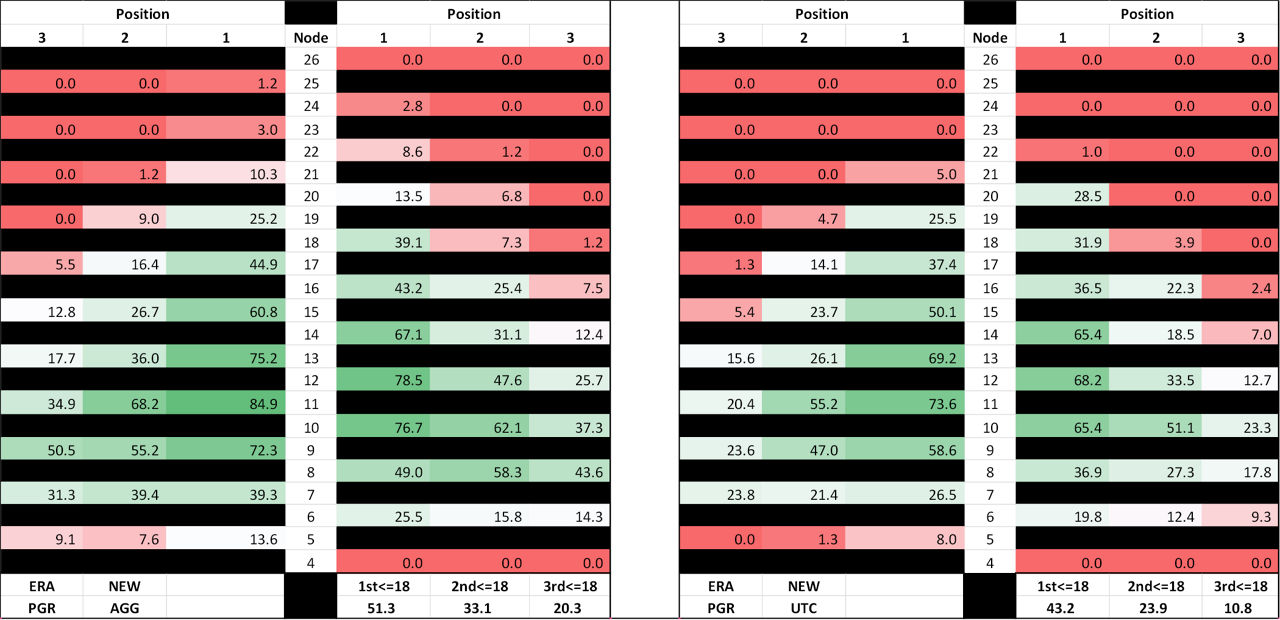
5. Probability of a Harvestable Sympodial Boll by Nodal Cohort
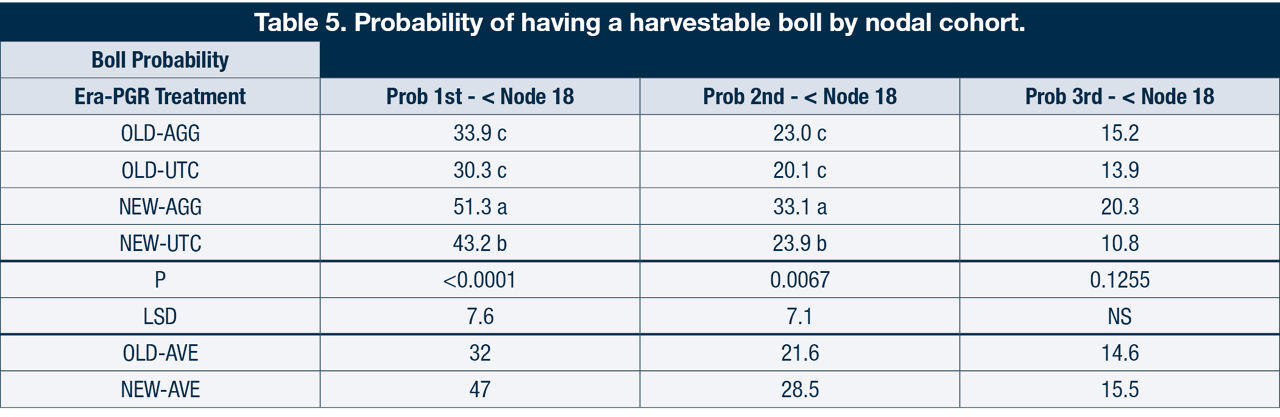
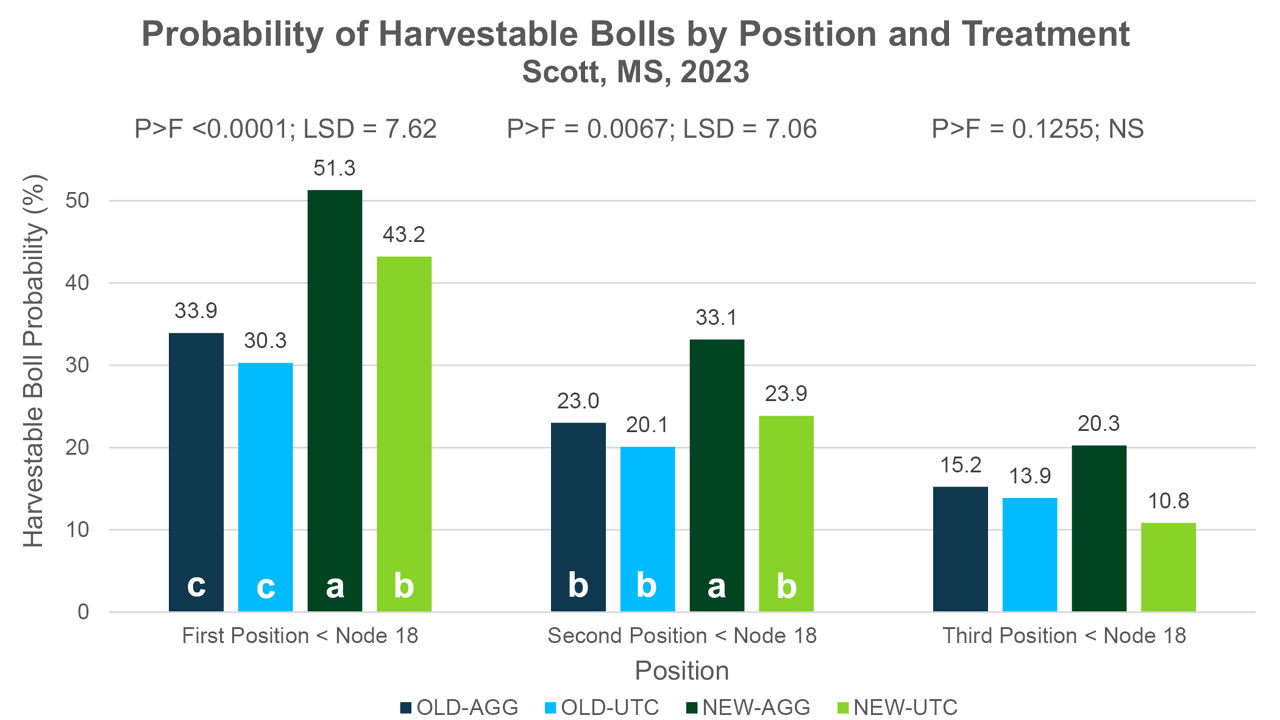
For this portion of the analysis, probabilities were averaged across all ERA-PGR combinations and calculations were made for the average probability of having a harvestable sympodial boll for each grouping. Bolls below node 18 were included since 18 nodes approximates the number of nodes needed to accumulate 95% of the harvestable yield (Table 1).
- Probability of a First Position Sympodial Boll on Nodes 18 and Below – Both NEW cohorts had a higher probability of setting first position sympodial bolls than either of the OLD treatments. PGR also significantly increased the likelihood of setting these bolls in NEW varieties.
- Probability of a Second Position Sympodial Boll on Nodes 18 and Below – The NEW-AGG cohort had a greater likelihood of setting second position sympodial bolls than did any other ERA-PGR treatment. PGR use had a significant impact on the likelihood of NEW varieties successfully generating a harvestable boll on these positions.
- Probability of a Third Position Sympodial Boll on Nodes 18 and Below – No statistical differences were observed in the likelihood of setting 3rd position bolls in any ERA-PGR treatment. It should be noted that numerical trends similar to both 1st and 2nd position sympodial fruit appear in the data particularly in the NEW variety cohort.
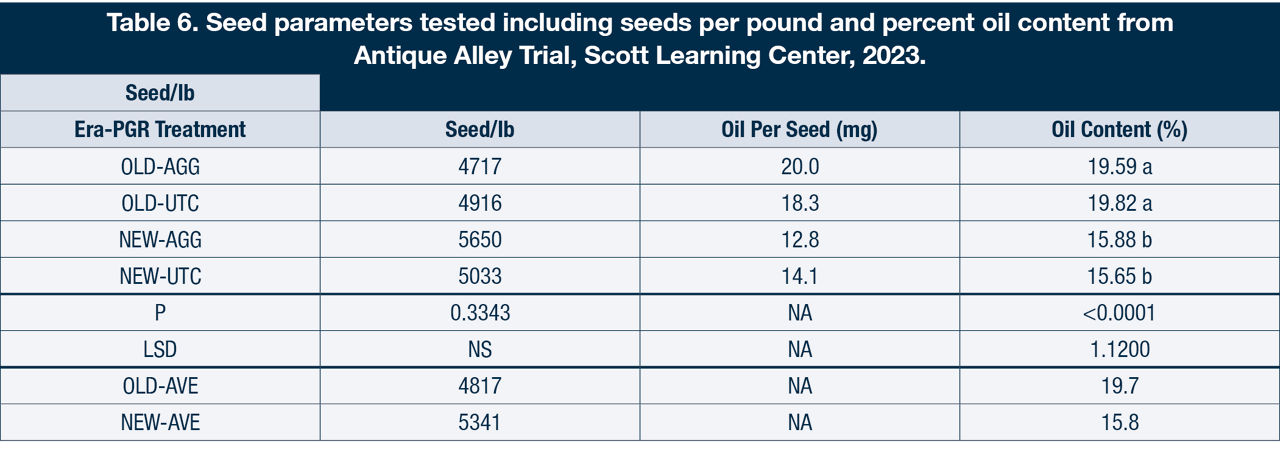
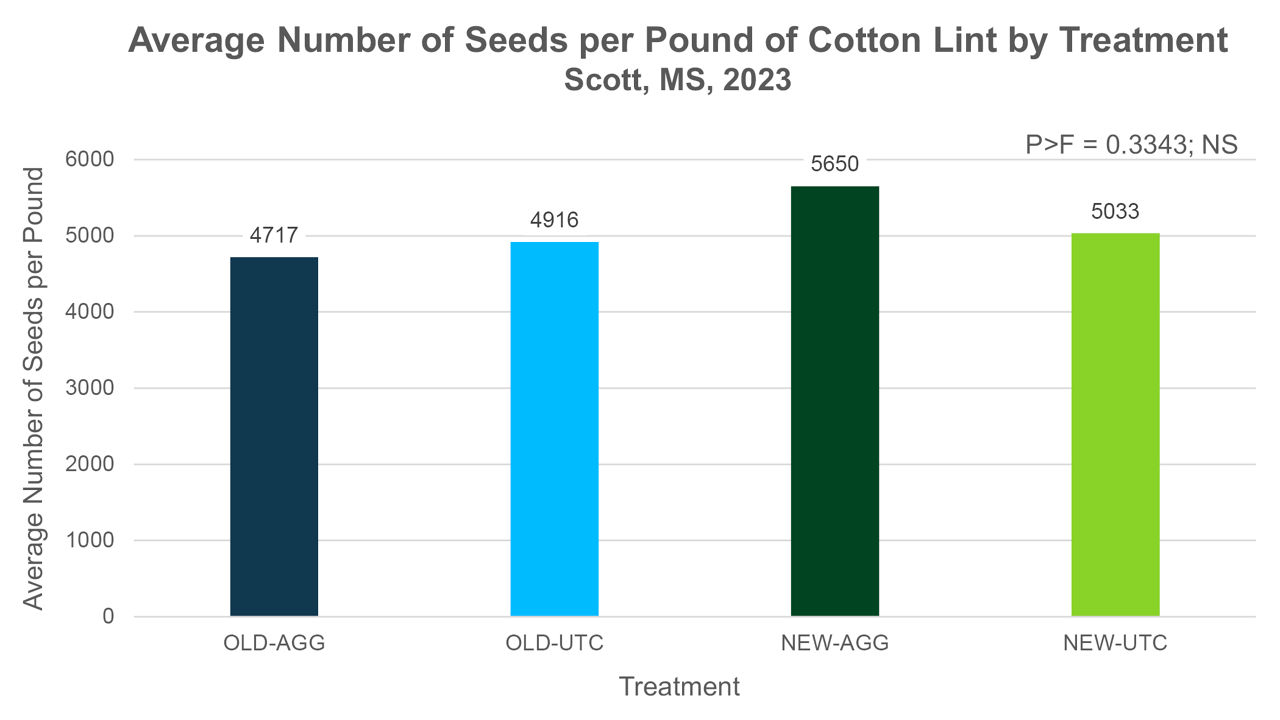
6. Seed Parameters – Seeds per Pound and Percent Oil Content
Results – Seed cotton samples were ginned, delinted, and processed to estimate seed size within the ERA-PGR combinations. Oil samples were laboratory analyzed to obtain estimations of the oil content percent of the tested samples.
- Delinted Seeds per Pound – No significant differences were measured in seed size across either of the ERA-PGR combinations. It should be noted that numerically smaller seeds were produced in the NEW-AGG treatment. This is similar to current commercial experience, in that seed size has generally decreased over time.
- Oil Content (Percent) – Oil content significantly decreased an average of 3.9% across the ERAs. This may have implications that are discussed below.
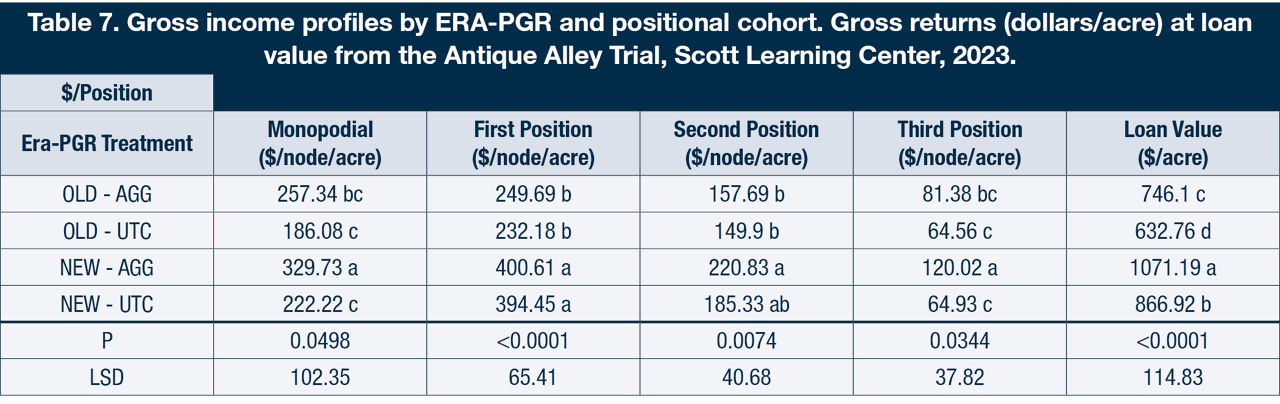
7. Gross Income – Total Returns by ERA-PGR and Positional Cohort
After ginning, actual loan values were established for each variety in the trial. From those values, gross income at loan value for each ERA-PGR combination was tabulated for the various boll cohorts. This considers lint percent, lint yield, and fiber value in each treatment combination.
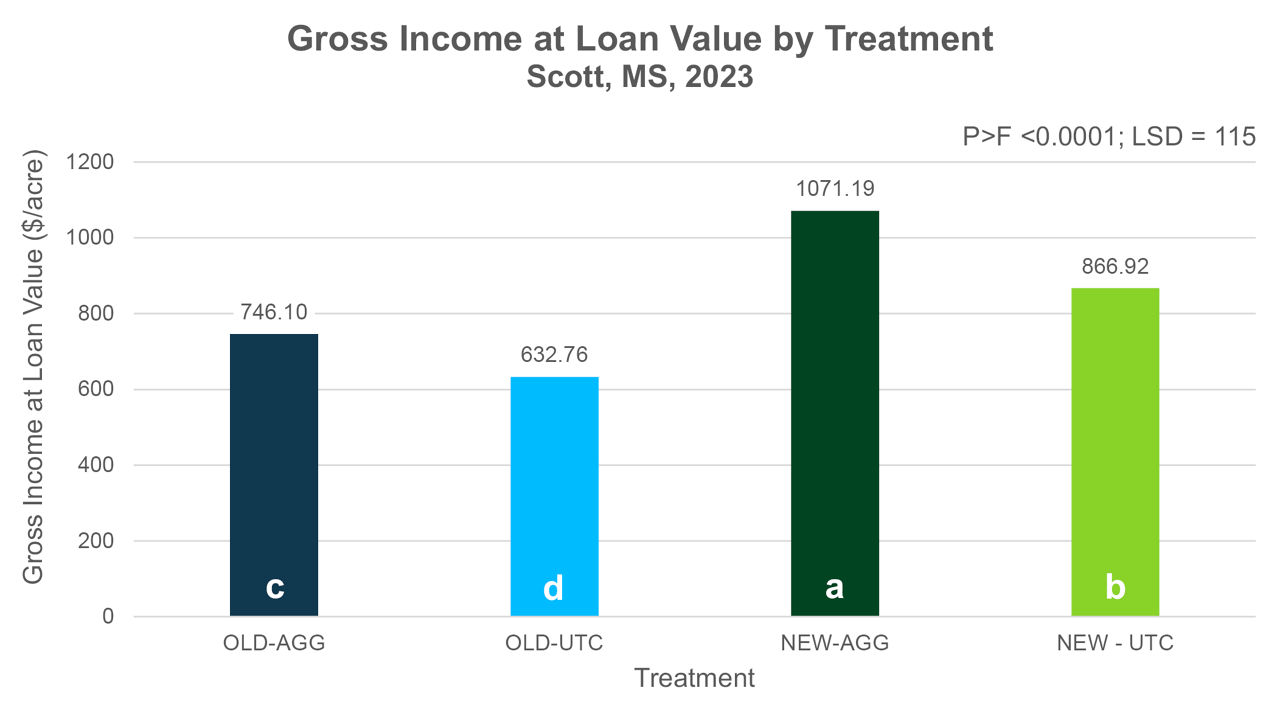
- Gross Income ($/acre) at Loan Value
- The NEW-AGG managed treatment produced significantly higher value/acre than any other treatment.
- Gross income in both NEW and OLD cohorts were significantly improved by PGR application.
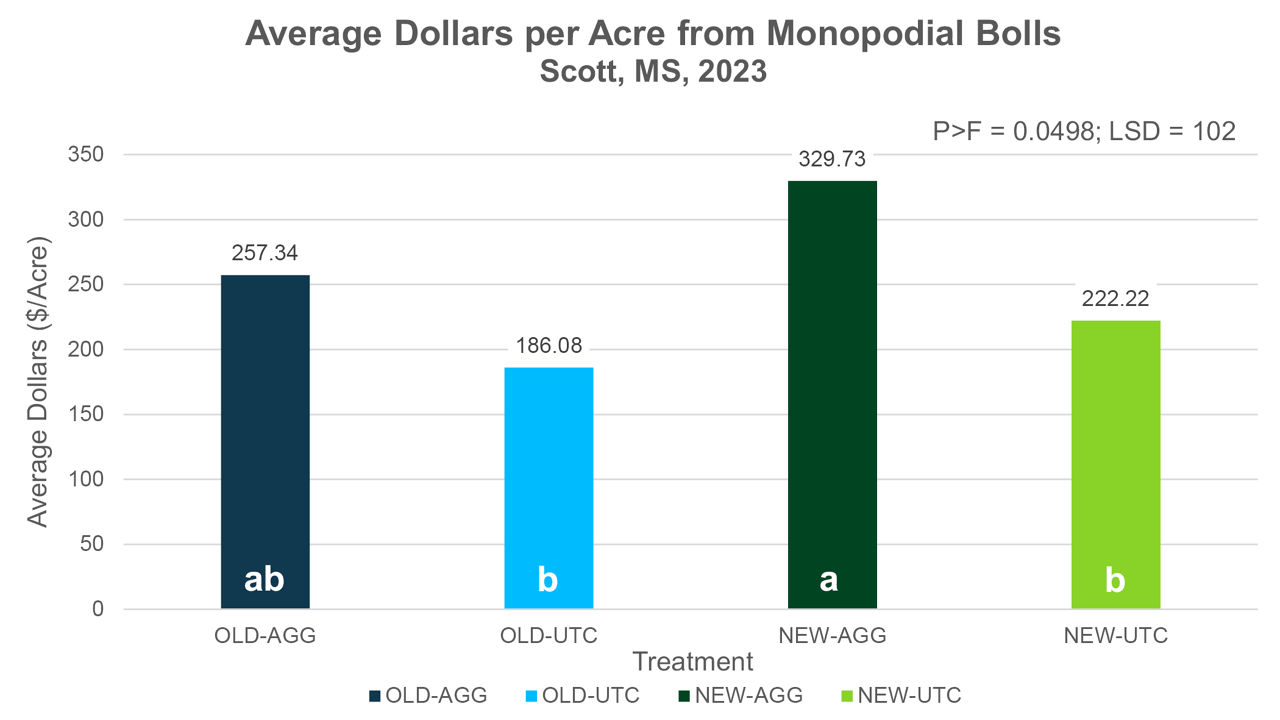
- Gross Income ($/acre) Produced from Monopodial Fruiting – The NEW-AGG cohort produced significantly greater gross income from monopodial fruiting than other treatments.
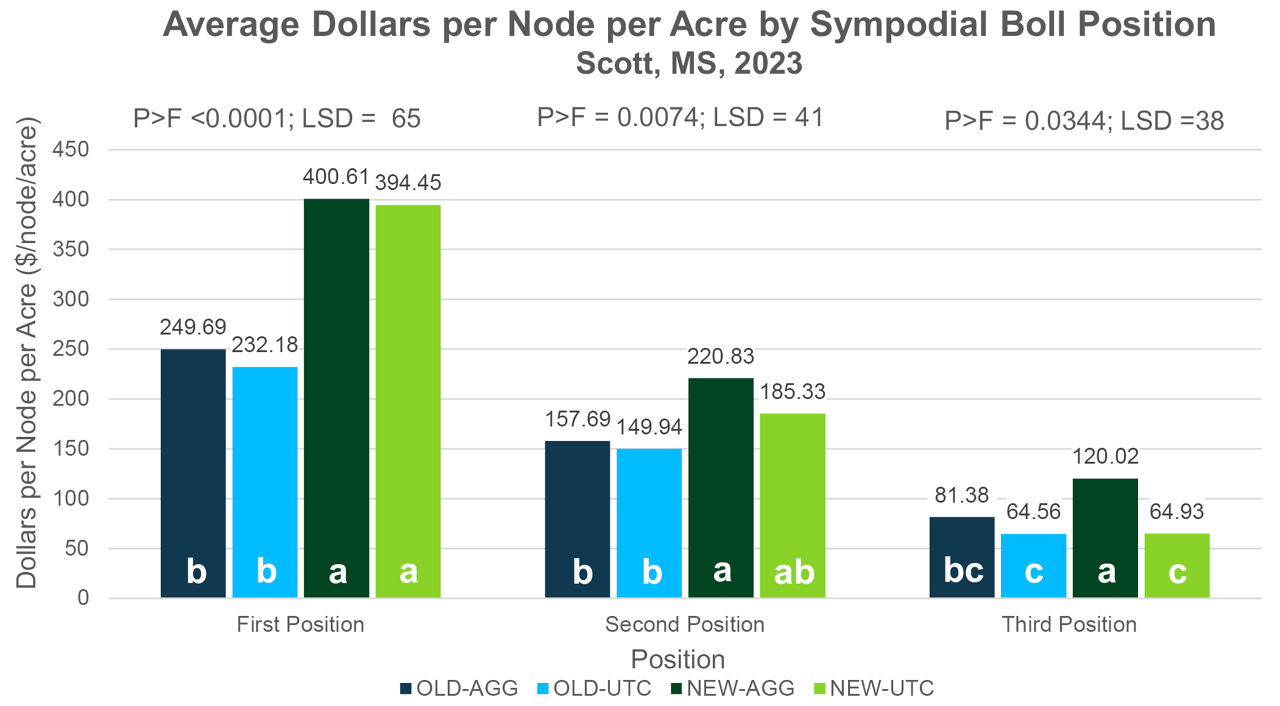
- Gross Income ($/acre) Produced from First Position Sympodial Fruit – Both NEW cohorts produced significantly greater income per acre than did either of the OLD cohorts. Both NEW and OLD were statistically similar within cohort.
- Gross Income ($/acre) Produced from Second Position Sympodial Fruit – The NEW-AGG treatment produced significantly more income from these positions than either of the OLD treatments. The NEW-UTC cohort was intermediate to the NEW-AGG and similar to the OLD cohorts in gross returns produced from these positions. This implies that AGG PGR in new varieties can, and likely does, push greater amounts in income into second position sympodial fruit.
- Gross Income ($/acre) Produced from Third Position Sympodial Fruit – The NEW-AGG treatment produced significantly greater income from third position sympodial fruit than other treatments. The remaining cohorts were statistically similar. From this, it can be implied that AGG PGR increases the income generated by third position sympodial fruiting forms, particularly in the NEW varieties.
8. System Based Yield Gains
Yield gains from the experimental factors in this trial can be divided into several primary components. These components include:
- System Wide Yield Gain – measures the yield gain from both breeding processes and PGR use across the various ERA-PGR combinations.
- Genetic Yield Gain – Primarily measures yield increases associated with breeding and/or varietal development.
- Managed System Yield Gain – A measure of the yield gain associated with both OLD and NEW varietal cohorts when grown in systems that are managed similarly with PGR.
- PGR Gain – Measures the yield gains associated with PGR use within both the OLD and NEW classes of tested products.
Several notable observations were recorded in the system evaluations. These factors are discussed below.
DISCUSSION
Discussion of these data would be incomplete without some commentary on the 2023 cropping season at the Scott Learning Center. The Scott Learning Center is in Scott, Mississippi at the ancestral home of Delta and Pine Land Company, where many of the tested varieties originated and were/are adapted to be produced. The 2023 season began as many seasons do in the Delta, with an extended rainy period. Several rainfall events exceeding 1 inch each occurred during planting and early development through early bloom. Post early-bloom, the season turned to more ideal conditions for cotton production. Mid-season conditions were very dry with bright clear sunshine, along with low relative humidities compared to most seasons. These conditions led to the development of very high yield potentials in most of the crops on the site, particularly cotton. When compared to previous seasons, we measured very low incidence (i.e., normal levels) of square/boll shed. Very low incidence (practically none) of any disease was observed across the study, including bacterial blight, boll rot, target spot, or any of the other diseases which typically impact cotton crops in the Delta. The harvest season finished almost ideally, with good defoliation conditions and nearly perfect harvest weather. For the above reasons, this should be viewed as a fair estimation of optimal yield potential in the central Mississippi Delta.
General Plant Development and Yield
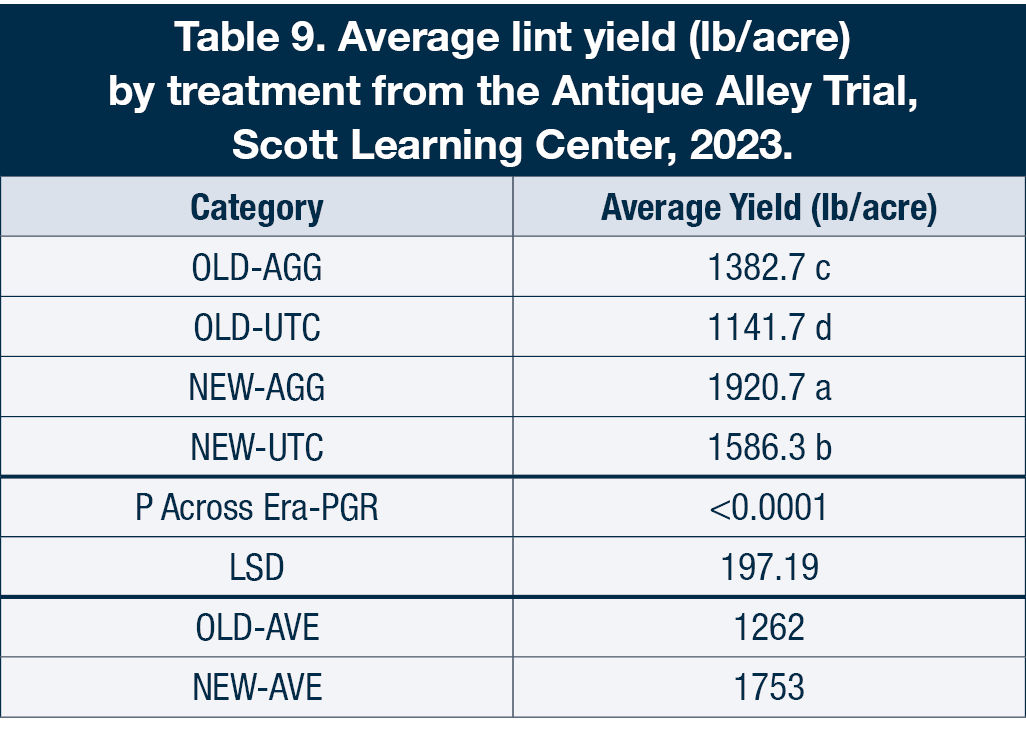
Final plant height, total node number, and the number of nodes generating 95% of the sympodial yield potential were not significantly different in any ERA-PGR combination (Table 1). The general view of this would be that at lower than 30,000 plants per acre the total time needed to complete plant development and assimilate 95% of the harvestable yield has not changed between the OLD and NEW cohorts of varieties, nor were these factors greatly influenced by plant growth regulator use. Several factors related to general plant and yield development were recorded to be significantly altered by either ERA and/or PGR applications. Lint percent (as defined as the ratio of lint to seed) was significantly different between the ERAs of production. The NEW cohort of varieties demonstrated an average increase in lint percent of 5.6% averaged across PGR application treatments within ERAs (Table 1). This may be a result of breeding selection and a major factor in increasing harvested lint yields in modern times. With a higher lint percent, smaller seed size, and/or reductions in oil content, the NEW varieties appear to allocate fewer resources to seed production allowing more resources to be allocated to lint production. This shift toward lint production must be balanced with proper PGR use to prevent shifting plant resources toward unnecessary vegetative growth. The total number of harvestable bolls was measured to be significantly higher in the NEW-AGG treatment than other treatments. The average increase in harvestable bolls from OLD to NEW varietal cohorts was 114,453 bolls per acre (32%) with the OLD-UTC having significantly less bolls harvested per acre than either of the NEW cohorts (Table 2). The significant increase in harvestable boll numbers is another major source of yield improvement in modern cotton crops. Not only do more squares survive to bloom, plants are also able to retain and/or fill more bolls in the modern era. Those retained bolls, on average, are also generally heavier due to the increases in lint percent. Lint per boll was not greater in any treatment (data not shown). However, boll size (grams seed cotton/boll) was not significantly heavier in this instance regardless of treatment (Table 2). That parameter was just outside the established 5% level of statistical significance (p=0.0614). The major—and possibly most significant—change recorded across this trial was observed in harvested lint yield per acre (Table 2). The NEW-AGG treatment yielded significantly more lint per acre than any other treatment at 1921 pounds per acre. The OLD-UTC treatment averaged 1142 pounds per acre. This is an increase in total yield potential of 779 pounds per acre (68.2%) across the total system from both PGR use and varietal improvement from 1996 to 2020.
This increase can be partitioned into two primary categories. The first category is the gain associated with breeding processes. When we compare the yields of the OLD-UTC to the NEW-UTC (neither of which had PGR applied) we observed a potential increase from 1142 pounds per acre to 1586 pounds per acre or 444 pounds per acre. This is a 38.8% yield increase from the genetic gain associated with breeding processes. When comparing PGR influences (UTC versus AGG within ERA), a yield improvement was measured in the OLD cohort of 241 pounds per acre (21%), which was statistically significant within the ERA cohort. When making a similar comparison between the NEW cohorts, we see yield improvement from 1586 pounds per acre to 1921 pounds per acre (UTC vs. AGG) or 335 pounds per acre (21%), which is statistically significant within the ERA cohort. While the percent increase is numerically similar between varietal ERAs (both ERA= 21%), the yield increase measured in pounds per acre is 39% greater (335 lb/acre vs. 241 lb/acre) when comparing the increase from PGR use between the OLD and NEW ERAs respectively. This is a sound indication that PGR use is a more critical component of obtaining optimal yield performance in NEW varieties and is likely much more important in NEW versus OLD germplasm.
Fruit Accumulation Patterns
When evaluating data that characterized yield accumulation for both percent of the total crop and pounds per acre of the crop by fruiting cohort, few differences were recorded. Measured in actual pounds lint by fruiting cohort, results were similar in that few shifts were measured in how the crop was positionally allocated by the plant (Table 3). One consistent difference occurred in both the percent of the total first position sympodial yield and the percent of the gross income from first position sympodial fruiting (data not shown). The NEW-UTC cohort partitioned a significantly greater proportion of both weight and income to first position sympodial fruiting than either of the OLD treatments. One hypothesis to explain this occurrence is that the NEW-AGG treatment redistributed some of the first position sympodial fruit (in both weight and income) to both monopodial and other more distal (second and third) sympodial positions as the result of PGR application (vs the NEW-UTC or either OLD cohort).
Lint Yield
All ERA-PGR combinations produced statistically similar lint yield (lb/acre and percentage of the crop) on monopodial branches (Table 3 and Table 4). Averaged across all ERA-PGR treatments, 28.7% of the total lint weight per acre was produced on monopodial branches. This is a stark change compared to the 6.6% contribution from monopodial fruiting reported by Jenkins and McCarty (1995).2 This is an increase compared to historical results, likely due to reduced seeding rates in the modern production system represented in this trial. Another factor may be that the OLD varieties were selected in higher plant population systems and may not respond similarly to the NEW varieties in lower plant populations. Other significant differences were observed in the various categories of fruiting. Pounds of lint per acre generated on monopodial branches plus first position sympodial branches (new category: MON + 1st) were combined for analysis. The primary justification for this combination was that these two categories likely contained bolls of similar age. When MON + 1st is evaluated, we see that the NEW treatments were statistically similar and produced significantly more yield in this category than either of the OLD cohorts, which were also statistically similar to one another (Table 4). Both NEW cohorts were statistically similar and produced significantly more first position sympodial lint yield per acre than the OLD cohorts (Table 4). The NEW-AGG grouping produced significantly more second position sympodial lint per acre than either of the OLD treatments (Table 4). This is further reinforcement of the potential for PGR shifting yield potential to tertiary fruiting positions. Both OLD-AGG and NEW-AGG produced statistically similar pounds lint per acre from third position sympodial bolls (Table 4). In both second and third position sympodial fruiting, it appears that PGR use increased the production of lint in both second and third positional cohorts.
Harvestable Boll Probability
The probability of a harvestable boll being present showed significant shifts across the ERA-PGR range. Boll presence probabilities were calculated (as percentages) for mapped sympodial positional cohorts for all nodes 18 and below. The NEW-AGG treatment showed the greatest average probability of setting harvestable first position sympodial bolls at 51.3% (Table 5). This was significantly greater than any other grouping in the trial, while the NEW-UTC treatment was statistically lower (versus NEW-AGG) at 43.2%. The OLD cohorts were statistically similar and averaged 32.1% probability. When considering the second position sympodial fruit, the NEW-AGG treatment demonstrated a significantly greater probability (32.1%) of setting bolls than any other treatment in the trial (Table 5). No differences were recorded in the probability of having a third position sympodial fruit in any of the cohorts (Table 5). These shifts, where present, are likely a major contributor to yield and gross return increases in modern cotton production systems.
Seed Parameters
No significant differences in seed size were measured across the study (Table 6). Oil content of the delinted seeds was measured (as a percentage) and significant differences were observed. NEW cohorts averaged 15.6% oil compared to OLD cohorts which averaged 19.6%, indicating a 4% decrease (from OLD to NEW) in oil content across the ERAs represented (Table 6). Considering the energy costs for oil production, this helps to partially explain yield increases observed in NEW varieties. Oil and protein are approximately two times more energy costly to manufacture than cellulose (lint) in plant physiological processes.1 Reductions in oil content can partially be explained as a contributing factor to increased cellulose production by the plant. That is, energy not used for oil and/or protein production is available for other plant processes, such as the manufacture of cellulose.
Production System Gains from 1995-2020
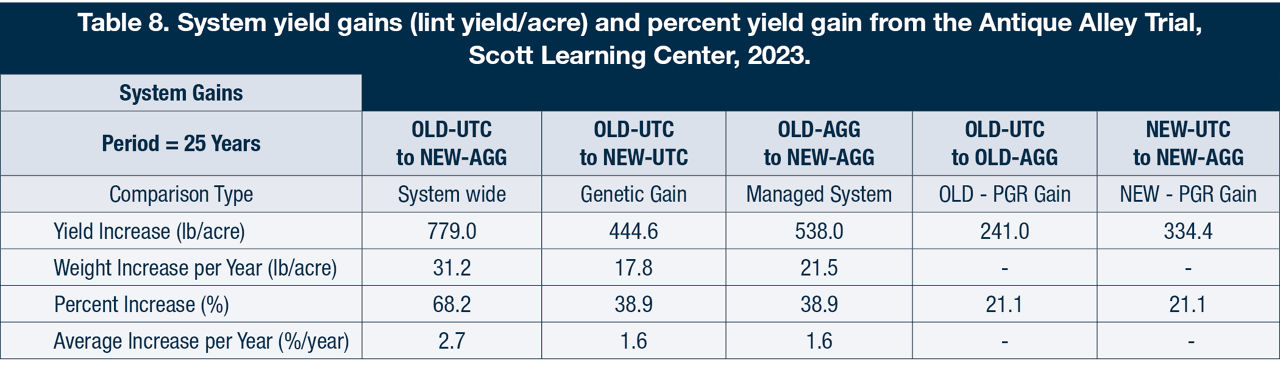
System Wide Gain – Across the represented period of variety development (25 years, Table 7) cotton yield potential increased from 1142 pounds per acre to 1921 pounds per acre. This represents a total increase in potential of 779 pounds per acre, which is a 68.2% increase over the period. When evaluated from the viewpoint of yearly increase, this is an increase per year of 31.2 pounds per acre or 2.7% per year. The reasons for these increases are manyfold and several are well explained by the data contained within this report. Changes in the ability of cotton plants to set and fill fruit, increases in lint percent, improvement in insect control, and plant growth regulator use all play a part in realizing these yield potential increases. This is likely an over estimation of the total gain, primarily due to the realization that even in OLD ERA, some PGRs were used. The Managed System discussion below can help provide insight into that issue.
Genetic Gain – Yield results from both NEW and OLD cohorts were considered when grown without PGR. Several observations can be made from this data. In a PGR-UTC system, yield over the represented period changed from 1142 pounds per acre to 1586 pounds per acre in the OLD and NEW cohorts, respectively (Table 7). This represents a yield increase of 445 pounds per acre over the period. This is a 38.9% gain in cotton yield potential from varietal improvement alone. The yearly gain associated with varietal improvement was measured as 17.8 pounds per acre per year or a 1.6% increase per year over the 25 years represented by the period based on results from this single study.
Managed System Gains – Historically, PGR use has been a tenuous effort. Varietal response, production system and grower preference have all played a part in the given intensity with which a grower chose to use PGRs in producing cotton. The system we had in place during this study was one that would be described as a “moderate” growth environment both in climate and PGR intensity. Compared to many systems, this site did not experience excessively growthy conditions. For all of the above reasons, the PGR system described here should be viewed as adequate but not excessive, likely representing close to ideal for both varietal eras, particularly for the 2023 conditions at the Scott site. The “managed system” is likely a better measure of the overall production system gains for the two represented ERAs rather than comparing OLD-UTC to NEW-AGG as described in the System Wide Gains section. In the case of comparing the OLD-AGG system to the NEW-AGG system, we see a 538 pounds per acre yield increase. This is 38.9%, which is similar to the varietal improvement gain and represents a gain of 21.5 pounds per acre per year or a 1.6% increase per year in cotton lint yield potential.
PGR Gains by ERA - During this experiment, differences in response of each ERA-PGR combination were documented through field observation, plant monitoring, machine harvest, and positional mapping. From this data, several observations can be made. Both NEW and OLD cohorts of varieties responded similarly to PGR use when measured as a percentage. Yield gains from PGR use were approximately 21% for both varietal eras (Table 8). However, it should be noted that the pound per acre yield response from PGR use in the NEW products was 38.8% larger than in the OLD category (334 lb/acre vs. 241 lb/acre, Table 8). This represents a potential yield gain from PGR use in NEW varieties of 93 pounds per acre versus the OLD varieties. This estimation does not account for responses to PGR use when other factors interact in the system such as weather-related fruit loss, insect damage or other causes of fruit shed in cotton. In many production systems, PGR use is a tool for use in remedial treatments when fruit shed does occur.
Gain Partitioning
When comparing Genetic Gain to the Managed System Gain, we measured a change in yield potential from 445 pounds per acre to 538 pounds per acre for a gain 93.4 pounds per acre between systems (Table 8). The PGR gain in the OLD cohort was 241 pounds per acre compared to 334 pounds per acre in the NEW cohort. Interestingly, when comparing potential PGR associated yield gain between the NEW and OLD cohorts, we measured an identical yield gain between varietal groups of 93.4 pounds per acre.
When considering the systems more broadly, a few preliminary conclusions can be made. Over the period from 1996 to 2020 (OLD-UTC versus NEW-AGG) the total, system-wide yield gain from both varietal improvement and PGR use was measured to be 779 pounds per acre (Table 8). When considering the varietal improvement gain (OLD-UTC versus NEW-UTC), a yield gain of 445 pounds per acre was measured. This leaves 334 pounds per acre for the remaining total gain to be accounted for in the data which, somewhat coincidentally, is exactly the yield gain measured from aggressive PGR use in NEW varieties (NEW-UTC versus NEW-AGG). The data contained within this report is strong evidence supporting a hypothesis that the remaining yield gain between systems is the result of timely, appropriate PGR use in modern varieties.
CONCLUSIONS
Nothing in cotton production can be considered conclusive; however, the observations in this report can be used to evaluate broad system changes that have occurred over the last 24 years. We measured changes in cotton productivity in many parameters across this study that concurred with grower experiences Beltwide. When considering many of the measured variables, the OLD and NEW varieties appeared to perform similarly with no significant difference identified. This would include examples such as total nodes, height, nodes in the 95% zone, lint production from monopodial branches, and many others. The effective fruiting zone of the plant has not changed greatly, other than a system-wide shift to significantly greater amounts of effective fruiting from monopodial positions. When considered as a whole, these variables would indicate that cotton plants in modern times (compared to 25 years ago) demonstrate a similar growth pattern and apportion fruit in similar ways across the ERAs of comparison. Several differences were recorded that help explain lint yield increases across ERAs. Lint percent, probability of harvestable boll presence, lint yields by position, fiber quality, and—ultimately—gross income were positively influenced by a varied set of factors over the period of comparison. Data contained within this report also indicates that proper PGR use is a more significant factor in NEW cotton varieties compared to OLD varieties. As a summary, through the confluence of breeding effort, information, and agronomic management, cotton producers today have access to cotton varieties that set more, generally heavier fruit. This gross change is primarily the result of building a better energy factory, which—when well-managed—can greatly contribute to the productivity of cotton fields through several well identified mechanisms. Ultimately, this data indicates that gross income potential (at loan) over the tested period has increased $438.43/acre due to the combination of breeding progress and crop management (PGR use).
Table 10. Visual demonstration of pounds generated per position, Antique Alley Trial, Scott Learning Center, Scott, MS, 2023.
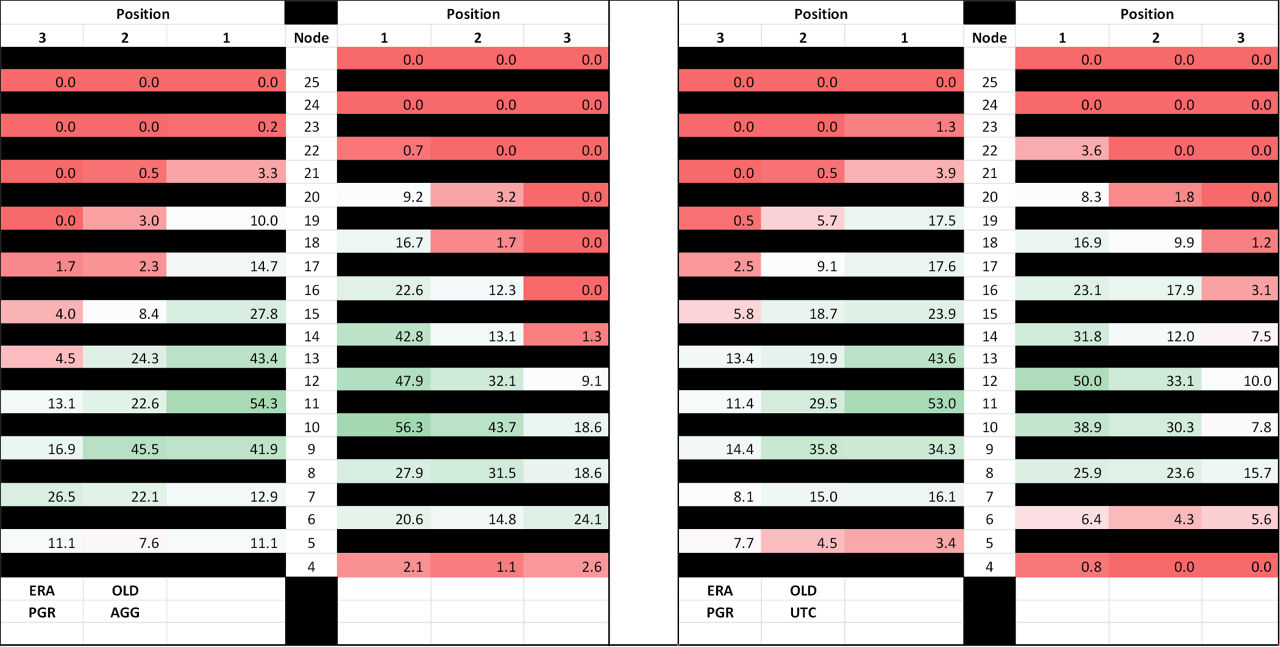
Table 11. Visual demonstration of pounds generated per position, Antique Alley Trial, Scott Learning Center, Scott, MS, 2023.
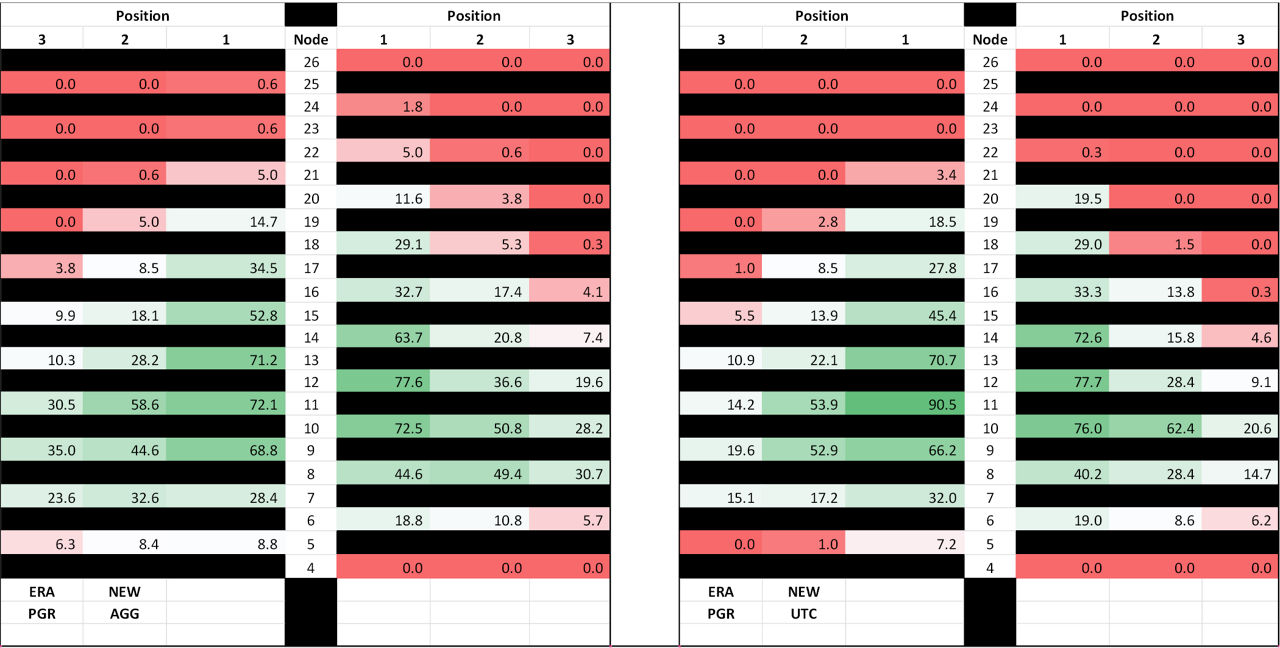
Table 12. Visual demonstration of gross income (dollars at loan price) generated per position, Antique Alley Trial, Scott Learning Center, Scott, MS, 2023.
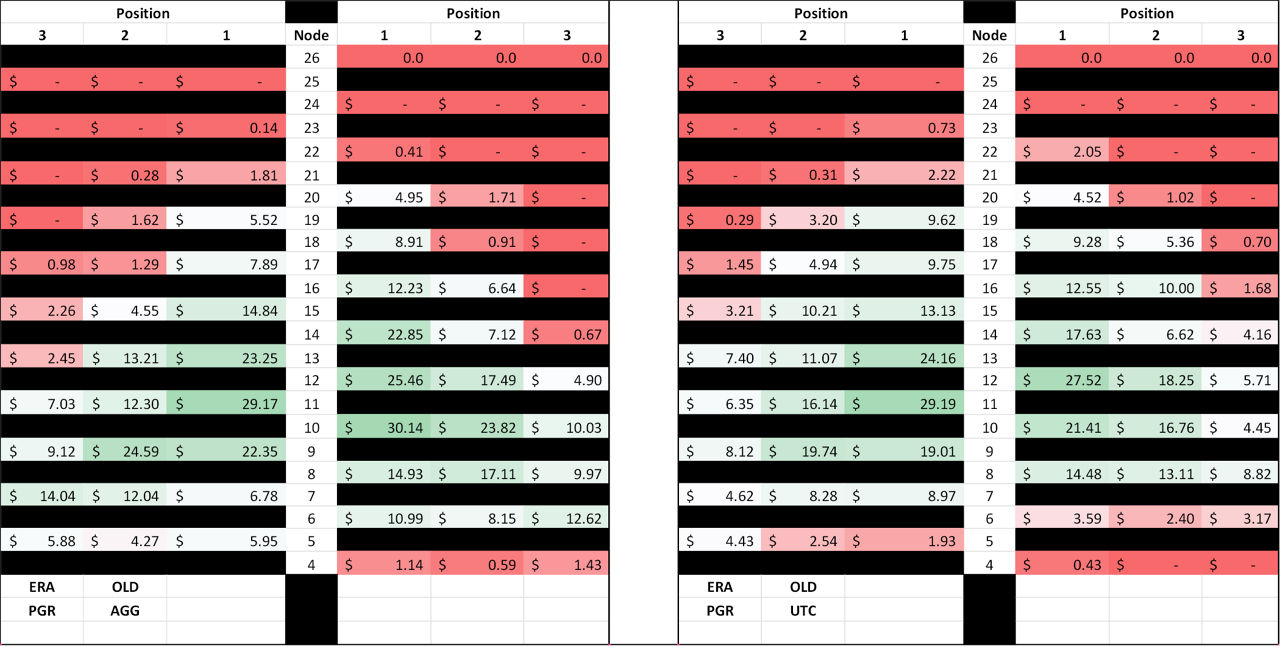
Table 13. Visual demonstration of gross income (dollars at loan price) generated per position, Antique Alley Trial, Scott Learning Center, Scott, MS, 2023.
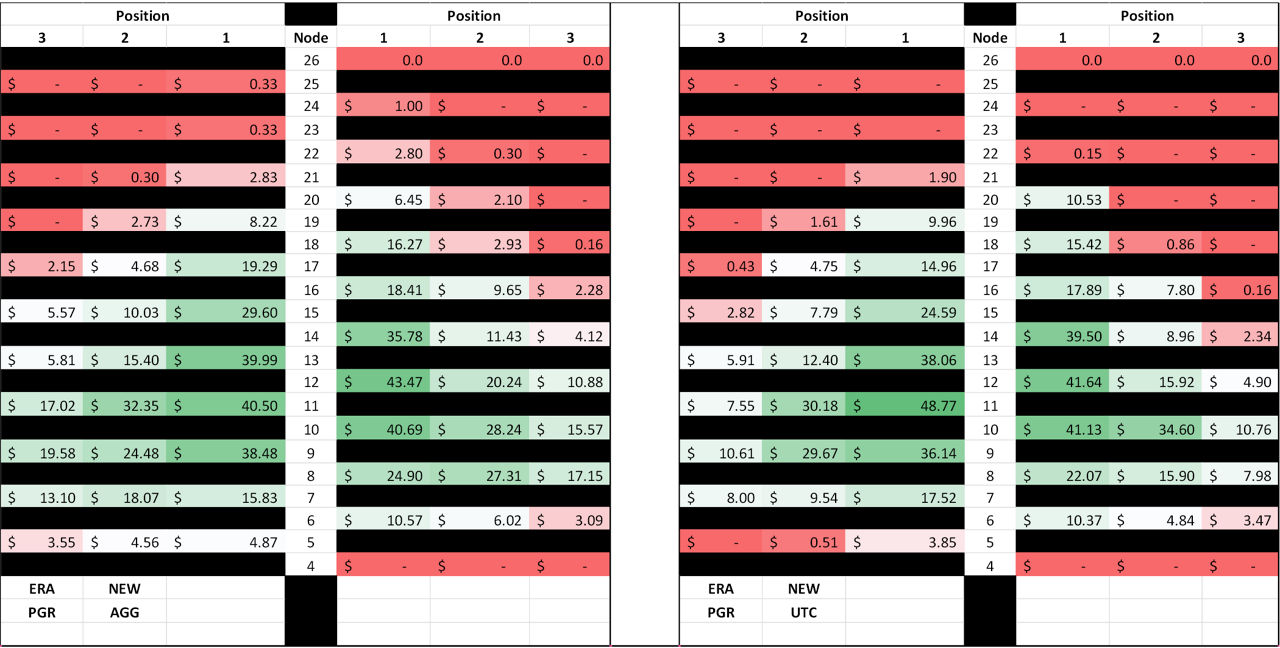
Table 14. Visual demonstration of the probability of having an open harvestable boll by fruiting position, Antique Alley Trial, Scott Learning Center, Scott, MS, 2023.
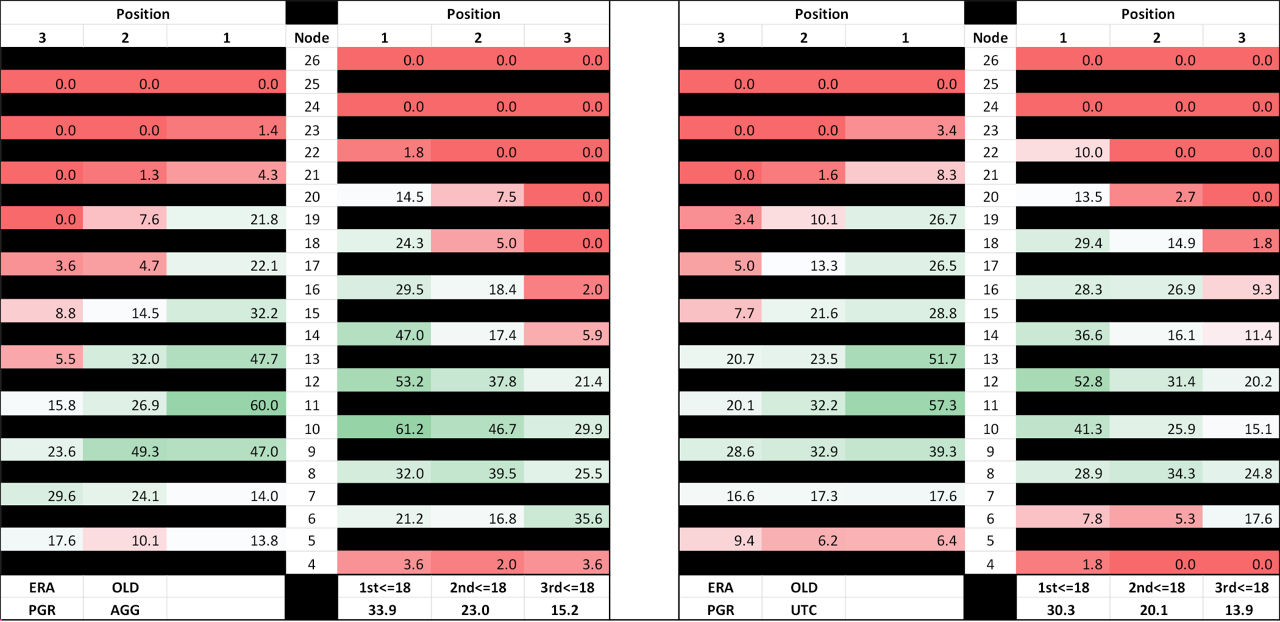
Table 15. Visual demonstration of the probability of having an open harvestable boll by fruiting position, Antique Alley Trial, Scott Learning Center, Scott, MS, 2023.
Sources
1Sánchez-Peña, M.J., Márquez-Sandoval, F., Ramírez-Anguiano, A.C., Velasco-Ramírez, S.F., Macedo-Ojeda G, González-Ortiz LJ. 2017. Calculating the metabolizable energy of macronutrients: a critical review of Atwater's results. Nutrition Reviews. 75(1): 37–48. PMID: 27974598.https://doi.org/10.1093/nutrit/nuw044
2Jenkins, J.N. and McCarty, Jr., J.C. 1995. Useful tools in managing cotton production: End of season plant maps. Mississippi Agricultural and Forestry Experiment Station. Bulletin 1024.
1414_345550