15 MIN READ
A Meta-Analysis of Cotton Response to Plant Growth Regulators from the Scott Learning Center 2011-2021
January 17, 2022
TRIAL OBJECTIVE
Scott Learning Center (SLC) conducts studies each season to evaluate the response of new and existing cotton products to plant growth regulator (PGR) mepiquat chloride applications.
A diverse set of varieties from across the cotton belt are tested each season representing the diversity in growth habit and determinacy present in current Deltapine® brand cotton products.
Historically, differential responses have been observed among the group of varieties tested.
This work is a summary of those responses from the long-term data from 2011 through 2021.
Cotton Yield by Production Era -1939-2019
From Bayer's Scott Learning Center in Mississippi, Jay Mahaffey explains the demo fields displaying intervals of 20 years of cotton starting from 1939 and going to 2019. Each interval shows significant difference in how much space is needed for the same yield.
RESEARCH SITE DETAILS
| Location | Scott, MS |
| Soil Type | Commerce/Forestdale silt loam |
| Previous Crop |
Corn |
| Tillage Type |
Conventional |
| Planting Date | May 1 or later |
| Harvest Date | Vary |
| Potential Yield (bu/acre) |
1900 |
| Seeding Rate (seeds/acre) |
41,000 to 45,000 |
- A total of 10 to 18 Deltapine® brand cotton products were tested each season.
- These studies were set up to encourage excessive vegetative growth due to strong background fertility levels, the previous corn crop, irrigation, and relatively high rates of nitrogen fertility (100 to 120 lb/acre of actual nitrogen soil applied as 32% liquid N).
- All agronomic inputs (weed control, insect control and irrigation) were per local standards for each treatment.
- There was no PGR trial in 2014 and no passive regime in the 2012 trial.
- All PGR plots were treated with labeled but varying rates and application timings of currently available mepiquat chloride (standard 4.2% formulation). These application rates and timings were used to separate differences in Deltapine® brand cotton variety responses and not necessarily to provide specific guidance on PGR management for an individual field, farm, or variety.
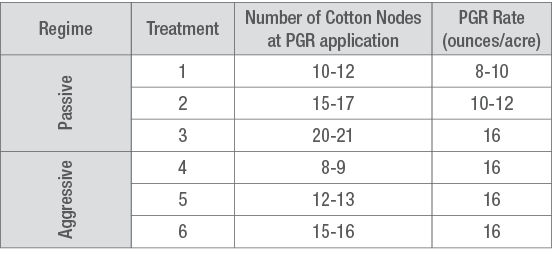
- Application regimes (Table 1) included:
- Untreated with PGR
- Passive Treatments – represents relatively lower rate/later timing
- Aggressive Treatments – Applied at labeled timings and within the max product use per season 48 ounces /acre.
- The various treatments are used to separate possible differences in varietal response not necessarily to provide specific guidance specific.
- Growth characteristics of Deltapine® brand cotton products tested were evaluated by:
- Stand establishment: monitored for normal emergence (data not presented)
- Plant growth: monitored in season
- End-of-season plant height: 10 plants/plot measured at harvest
- Height reduction from either the passively or aggressively managed treatments versus the untreated check.
- Representative turnouts from trials at the SLC were used to estimate lint yield/acre to evaluate yield effects of PGR treatments.
- Analysis conducted in two parts for 2021
- Part 1
- Deltapine cotton variety sensitivity to PGRs – PGR application growth reduction was calculated as the percentage that plant height was reduced when compared to the untreated plot.
- Cotton varieties were then characterized by the percent growth reduction to indicate PGR sensitivity within each year as either:
- More Responsive – Cotton varieties considered more responsive were the top 50% in plant height of the Deltapine cotton varieties within the year tested.
- Less Responsive– Cotton varieties considered less responsive were the bottom 50% in plant height of the Deltapine cotton varieties within the year tested.
- Cotton varieties were then characterized by the percent growth reduction to indicate PGR sensitivity within each year as either:
- Deltapine cotton variety sensitivity to PGRs – PGR application growth reduction was calculated as the percentage that plant height was reduced when compared to the untreated plot.
- Part 2 Regression Analysis
- Varietal Characterization – for the purposes of this analysis Growth Reduction was calculated as the percentage that plant height was reduced in the Aggressively managed plots vs the untreated.
- Used as an indication of sensitivity to PGR and each variety in the testing series - data not shown.
- Varieties were then segmented by percent growth reduction as an indication of PGR sensitivity within each season as either:
- More Responsive – Cotton varieties considered more responsive were the top 50% of the Deltapine cotton varieties within the year tested. Less Responsive – Cotton varieties considered less responsive were the bottom 50% of the Deltapine cotton varieties within the year tested.
- Cotton products were further segmented into cohorts based upon untreated plant heights.
- TALL in the untreated plots – those varieties with plant heights in the upper 50% of the population.
- SHORT in the Untreated plots – those varieties with plant heights in the lower 50% of the population.
- Part 1
UNDERSTANDING THE RESULTS
UNDERSTANDING THE RESULTS
- All conclusions from this data are highly interactive with the production system and environmental conditions during each growing season and should be viewed as such.
Part 1 Results
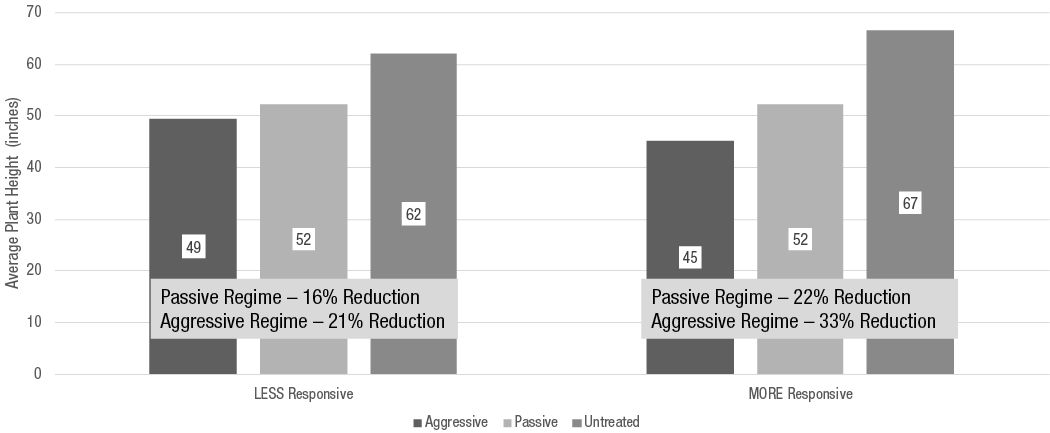
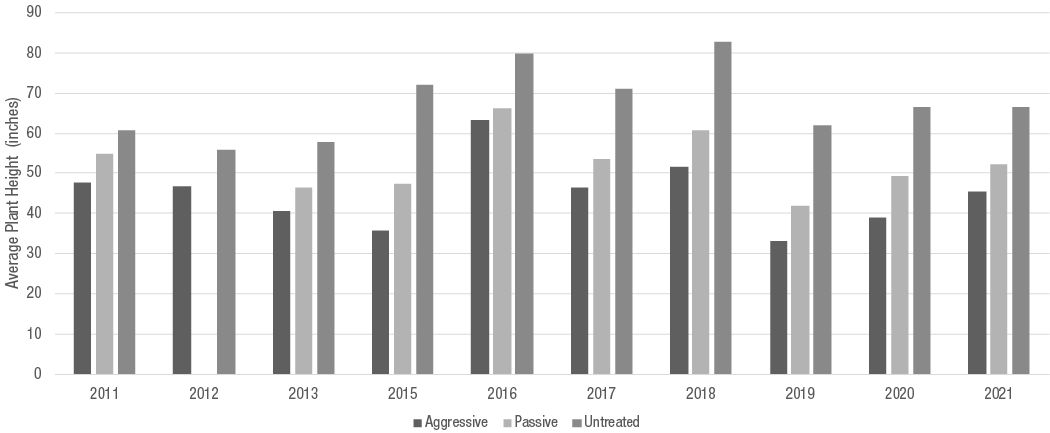
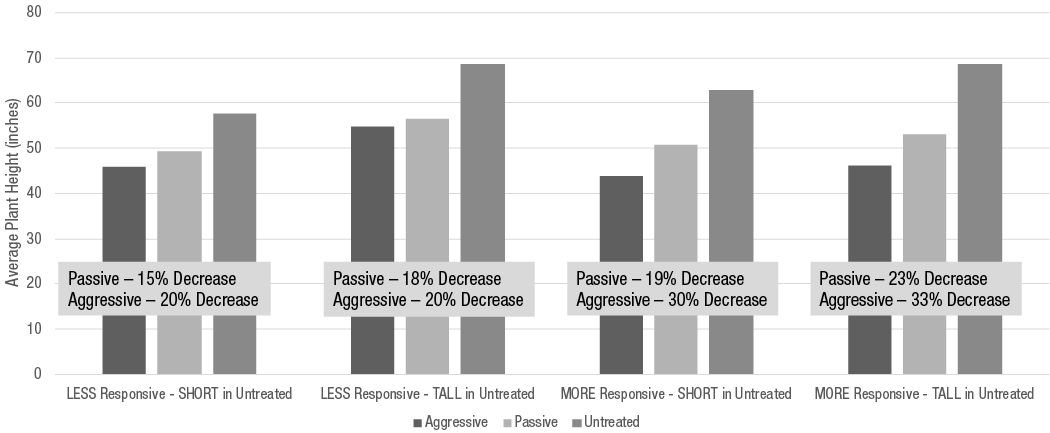
Plant height observations
Over the testing series, in response to the aggressive regime PGR applications Less Responsive varieties showed an average reduction in height of 21% where More Responsive products showed a reduction in 33% indicting a difference in responsiveness between categories (Figure 1A).
The Passive PGR regime treatment response was intermediate in both More and Less Responsive categories
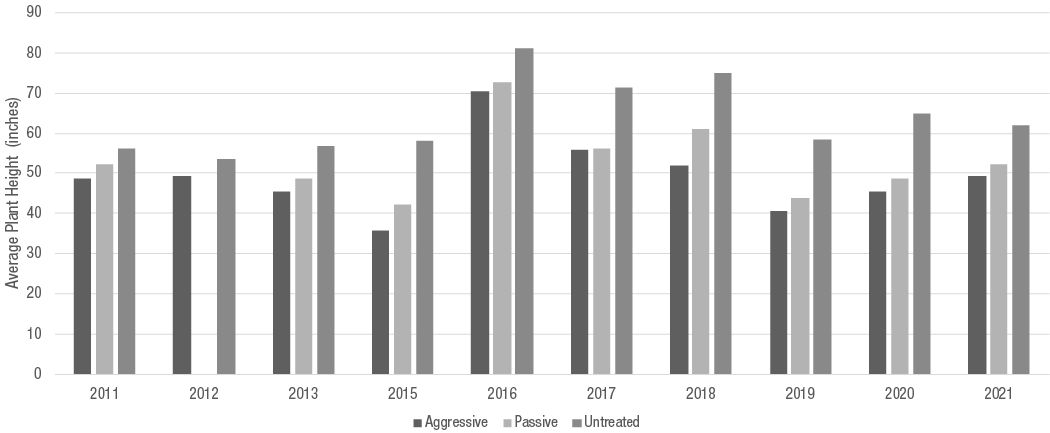
Yearly summaries of PGR application regime impact on plant height are shown in Figures 2A and 2B.
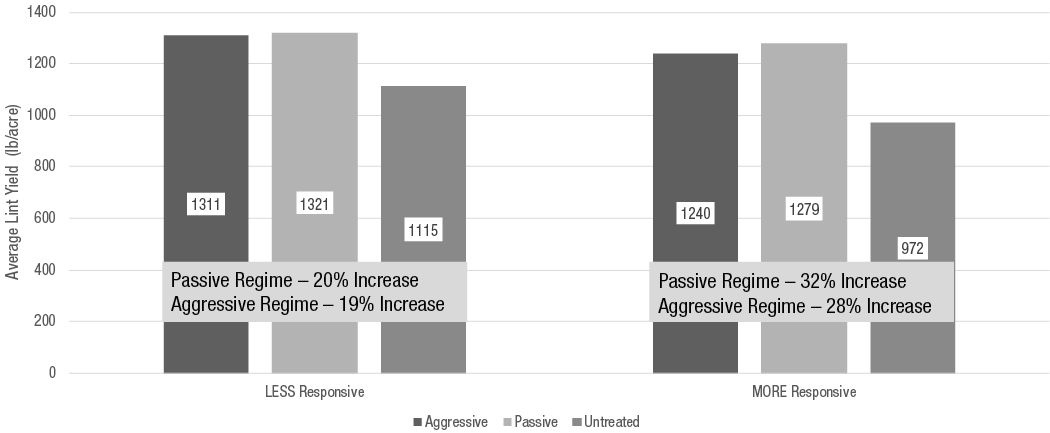
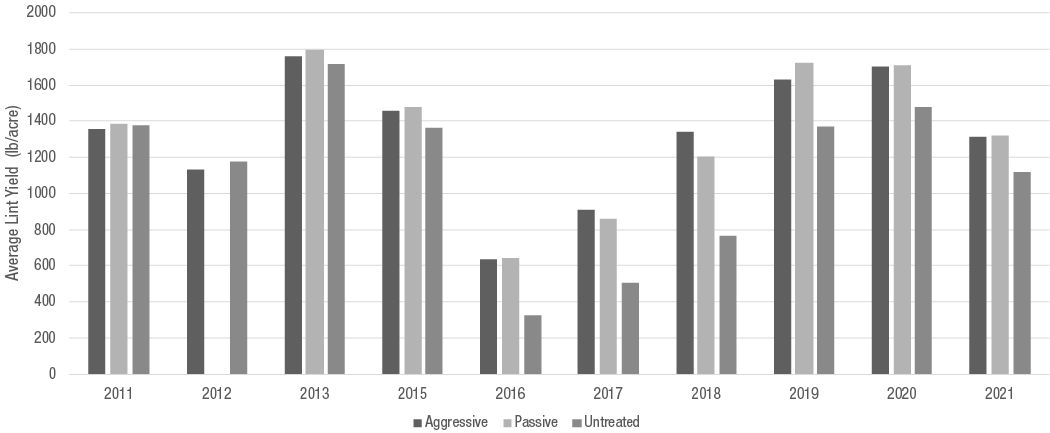
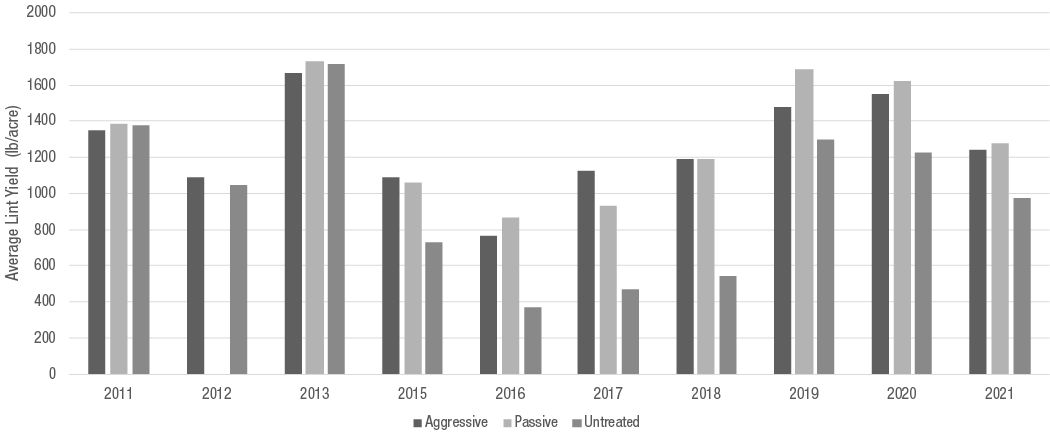
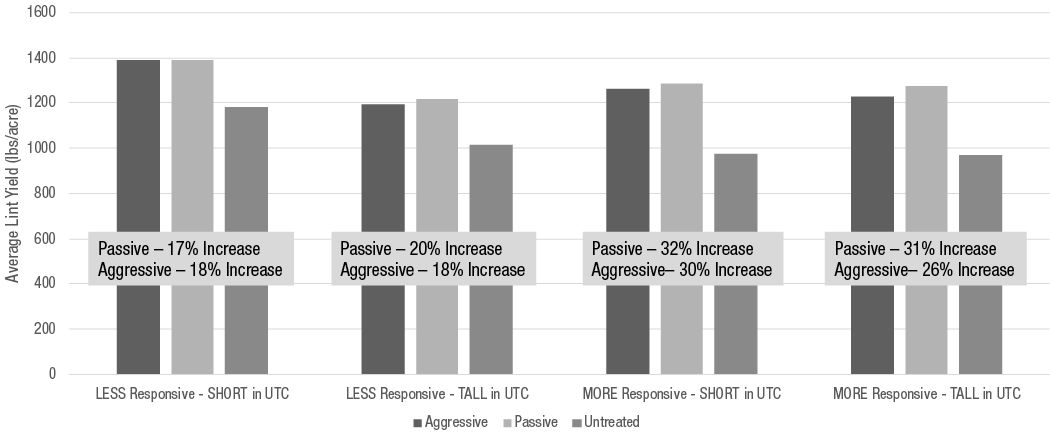
Lint yield observations
The Less Responsive cotton varieties demonstrated slightly higher yield potential than the More Responsive cotton varieties in all PGR regimes (Figure 1B).
Over the testing series, in response to either PGR application compared within response category, both Less and More Responsive varieties showed a numerically similar yield increase (Figure 1B)
However More Responsive products showed a numerically larger increase in yield vs Less Responsive products – 28% vs 19%.(Figure IB)
Across the range of testing, the Less Responsive products, which are generally more difficult to manage, demonstrated higher yield potential than More Responsive varieties.
Local variety adaptation likely plays a role in the observed responses.
Part 2 Results
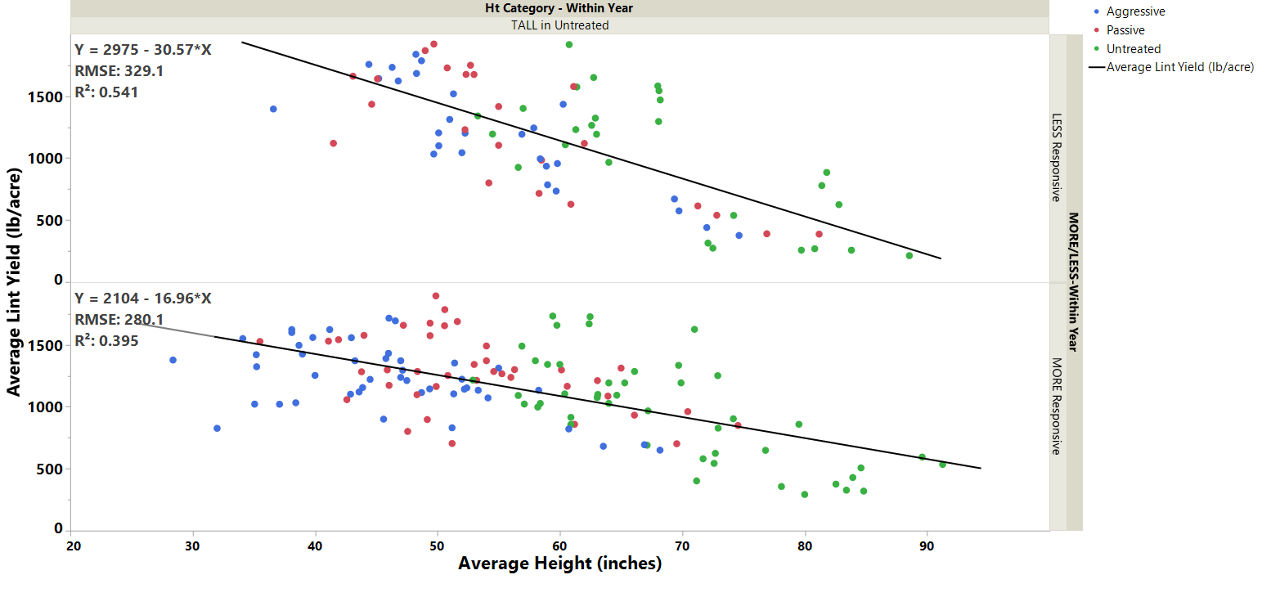
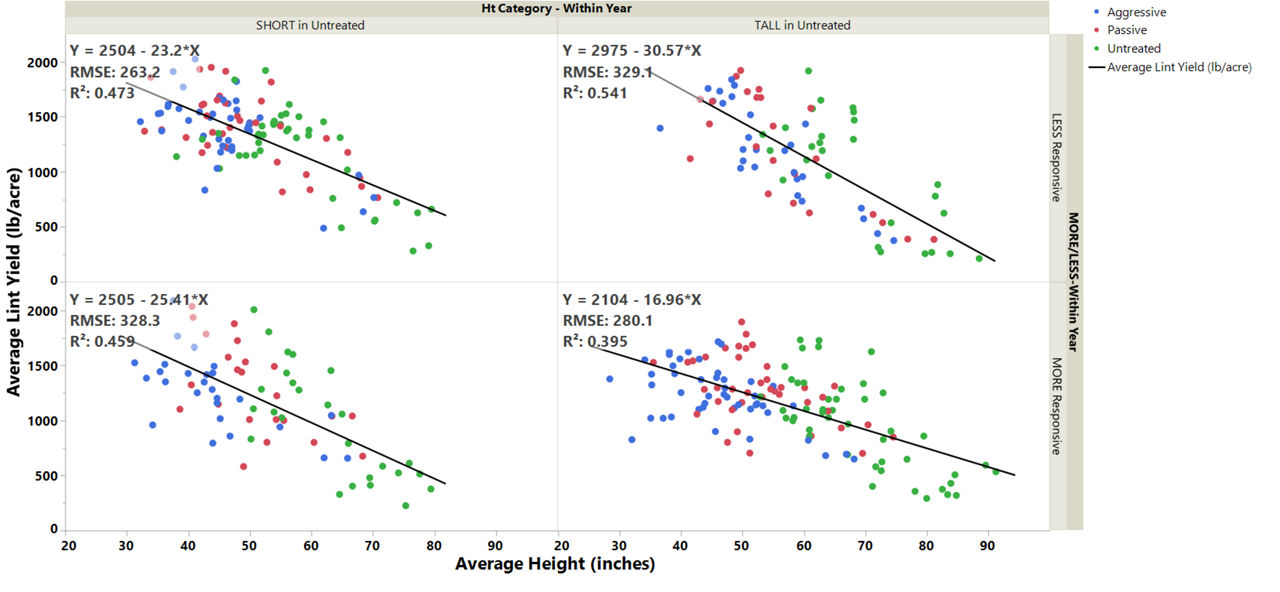
- The Less Responsive cotton products showed a statistically significant greater decrease in average yield potential than the More Responsive cotton varieties in response to excessive height (Figure 4B).
- SHORT cohorts (regardless of PGR response) showed a decrease in average yield of 24 lb lint/acre/inch to increasing height (Figure 4B).
- Approximately 15% more of the yield variability can be accounted for in height (as measured by R2) in the LESS responsive varieties when comparing the TALL vs SHORT varieties.
- A statistically significant difference in the yield response to final plant height was observed between response classes (student’s t P=0.0003; 205 df)
- TALL cohorts demonstrated differential responses to increasing height
- Differences in slope between categories
- TALL-MORE Responsive = - 16.96 lb lint/acre/inch
- TALL-LESS Responsive= - 30.57 lb lint/acre/inch
- It’s important to note that even TALL / Less Responsive varieties can be managed to the high yield potential ranges of the More Responsive or SHORT varieties within the maximum labeled rate of mepiquat chloride (Figure 4B).
- Differences in slope between categories
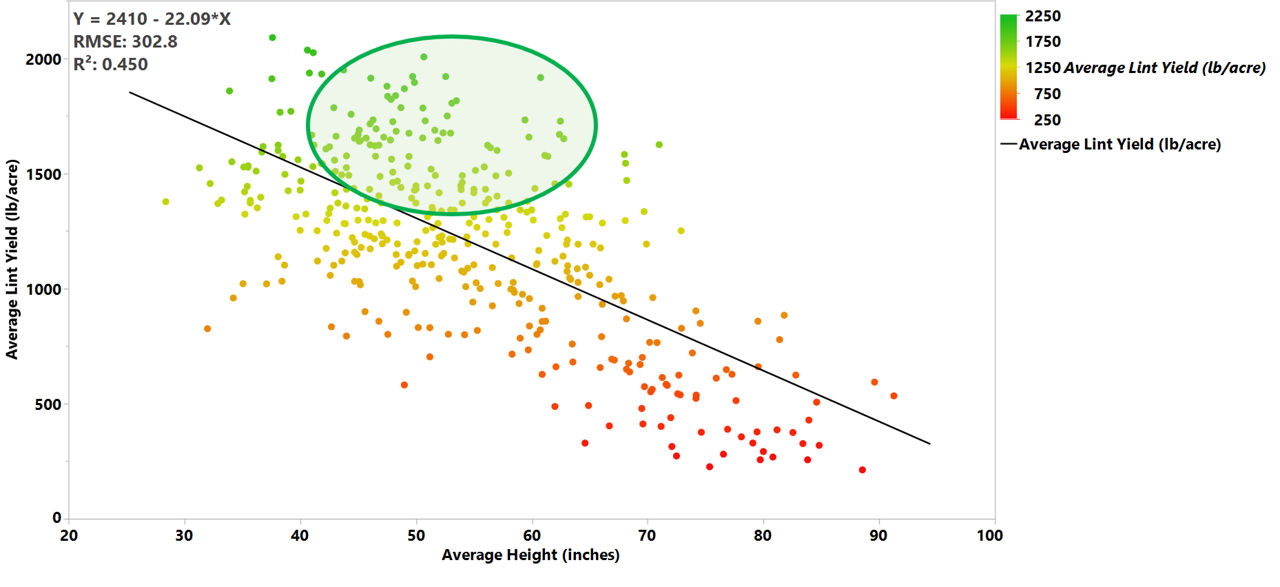
The yield response due to additional height is likely a function of the effect of the plant allocating energy to vegetative growth, the shading that occurs from neighboring plants, and associated fruit shed. Plants can also shade themselves as a result of excess height. An individual fruiting structure (squares particularly) is photosynthetically independent of the plant and if shaded, is more likely to shed just after bloom due to the lack of available sugar. Bolls are not independent, and the plant senses their need for sugar (to make carpals, seed and lint) hormonally. If it’s not there for whatever reason, the boll will shed in the week or so after bloom. That’s why this is all a big cascade of an effect. None of it occurs due to a single cause (Figure 6).
When creating management plans for Less Responsive cotton varieties, early and timely applications of PGRs at appropriate rates are even more important.
When the cotton variety sensitivity to PGR is known, a management system can be built factoring in their growth tendencies.
To help obtain optimal value from the cotton varieties and the traits they contain, this information should be considered for every cotton variety, field, and farm.
KEY LEARNINGS
- All conclusions from this data are highly interactive with production system and should be viewed as such.
- Across this range of testing, several conclusions can be drawn:
- The MORE Responsive cotton products demonstrated as much as 10% greater height reduction in the Aggressive regime vs untreated when compared to the LESS Responsive products. Figure 5A
- The LESS Responsive TALL products showed a significantly greater decrease in yield than the MORE Responsive TALL products in response to excessive height = -31 lb/inch vs -17 lb/inch. Figure 4A and4B
- PGR use in cotton crops is a tool that can be used to help manage excessive vegetative development and increase yield.
- Significant differences exist in the response of cotton variety classes to PGR application.
- For this reason, understanding the PGR sensitivity of cotton varieties is essential in developing a management plan for the product planted on a given farm or field.