Crop ScienceUnited States
Dry Down, Test Weight Change, and Yield Comparison of Four Different Corn Maturities in Canandaigua, New York
March 10, 2023
TRIAL OBJECTIVE
- In New York, corn products are offered in a range of relative maturities (RM): from mid-80 to mid-100 RM depending on growing region.
- Growers tend to plant the latest (longest) maturity suitable for the region to obtain the greatest yield potential.
- With unpredictable weather patterns and chances of early freezing events it is important to consider the use of earlier (shorter) relative maturities to allow earlier harvest timing with a higher quality corn and fewer complications with harvest.
- The objective of this research is to understand how different relative maturities dry down under New York conditions.
RESEARCH SITE DETAILS
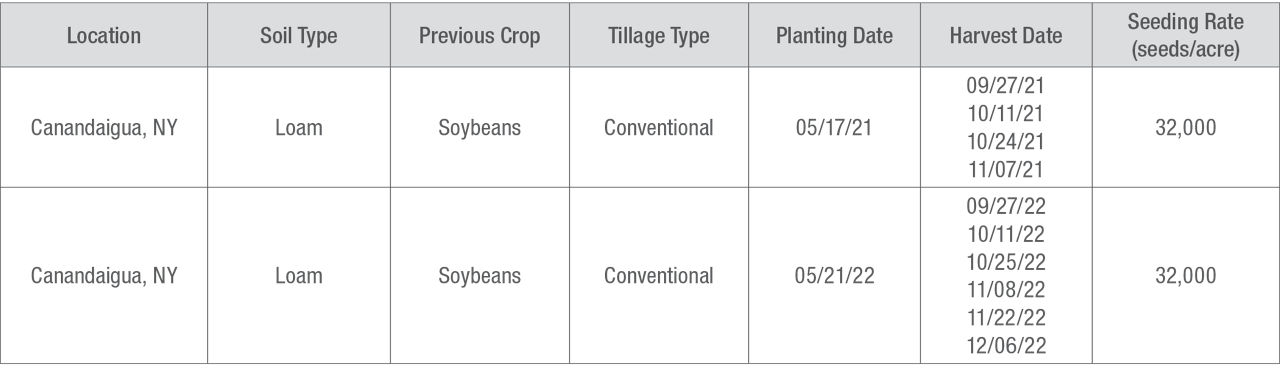
- The trial was conducted at the Bayer Market Development Research Farm located in Canandaigua, New York in 2021 and repeated in 2022.
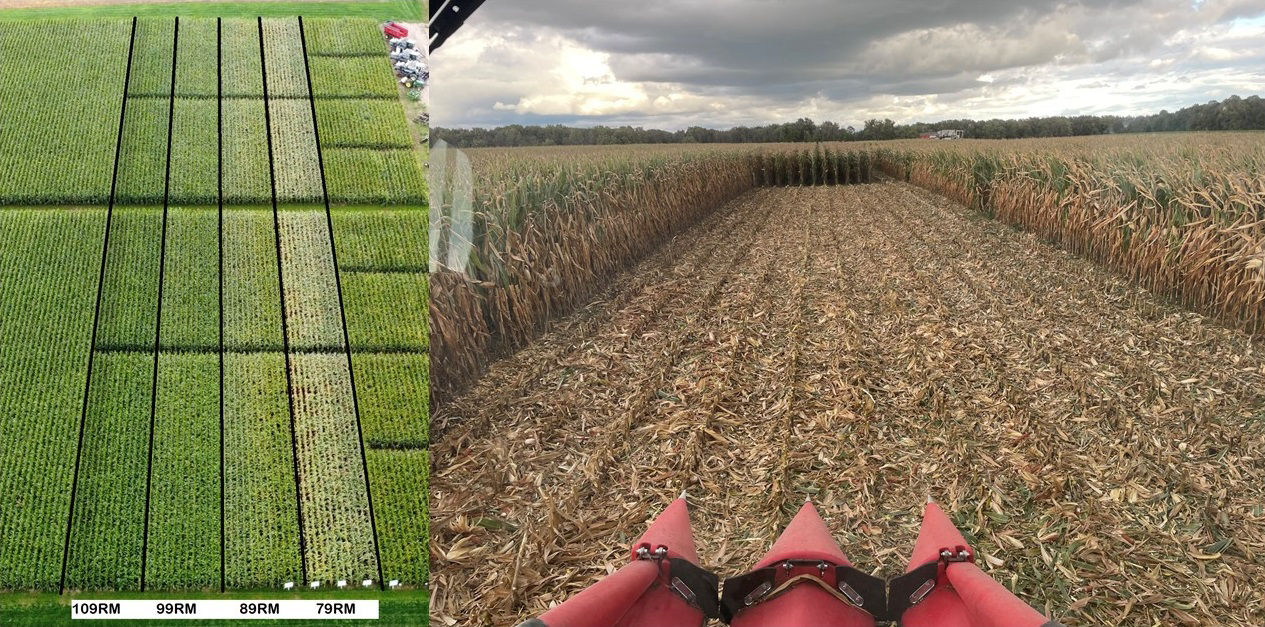
- Three Bayer corn products for each of the relative maturities (RM): 79, 89, 99, and 109 for a total of 12 corn products were used for this trial.
- The trial was conducted as a strip trial with no replications.
- Individual plots were 10 feet wide by 120 feet long.
- A four-row John Deere planter equipped with Precision Planting® vSet® meters was used to plant the trial.
- 50 pounds of nitrogen/acre was applied at planting on a 2-inch by 2-inch setting, and 160 pounds of additional nitrogen/acre was knifed in at the V4 growth stage.
- Each corn product was harvested at three different times. The initial harvest was targeted at 25% moisture. The two other harvest times at approximately 14 and 28 days after the initial harvest.
- Harvest was done with a small-plot combine. Only the two center rows were harvested for data.
- Yield data was standardized at 15.5% moisture.
UNDERSTANDING THE RESULTS
Dry down rates
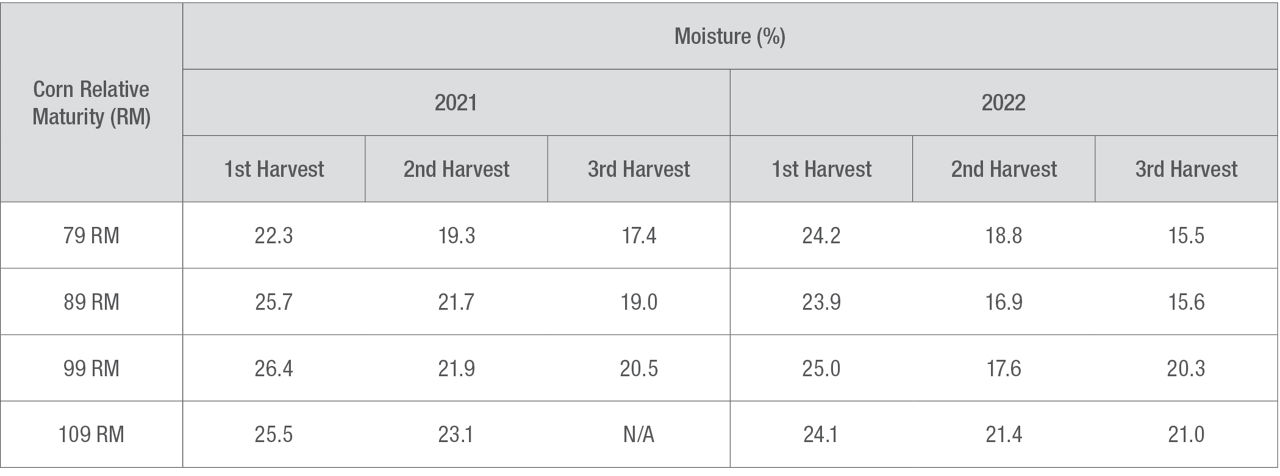
- Overall, corn products with 79 and 89 RM had greater dry down rates when compared to 99 and 109 RM corn products in both years (Figure 2 and Table 1).
- Dry down rates were greater for 2022 compared to 2021 due to lack of precipitation and a warm fall temperature.
- Moisture increased nearly three percentage points for the 99 RM corn products between the second and third harvest of 2022. This was due to 1.8 inches of rain on November 11th followed by a week with average temperatures near freezing.
- The last harvest for the 109 RM corn product was not able to be done in 2021 due to weather conditions.
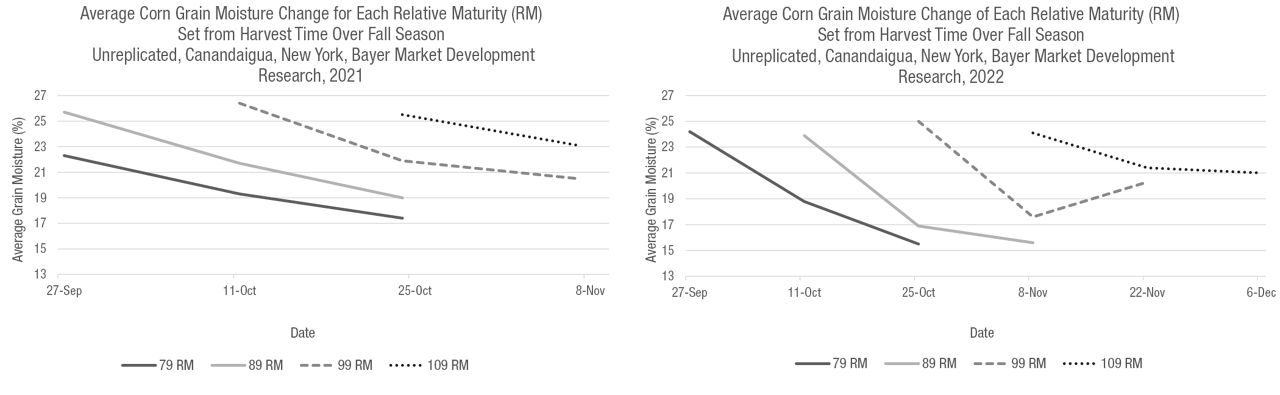
Table 1. Moisture (%) for each relative maturity group at three harvest timings for 2021 and 2022.
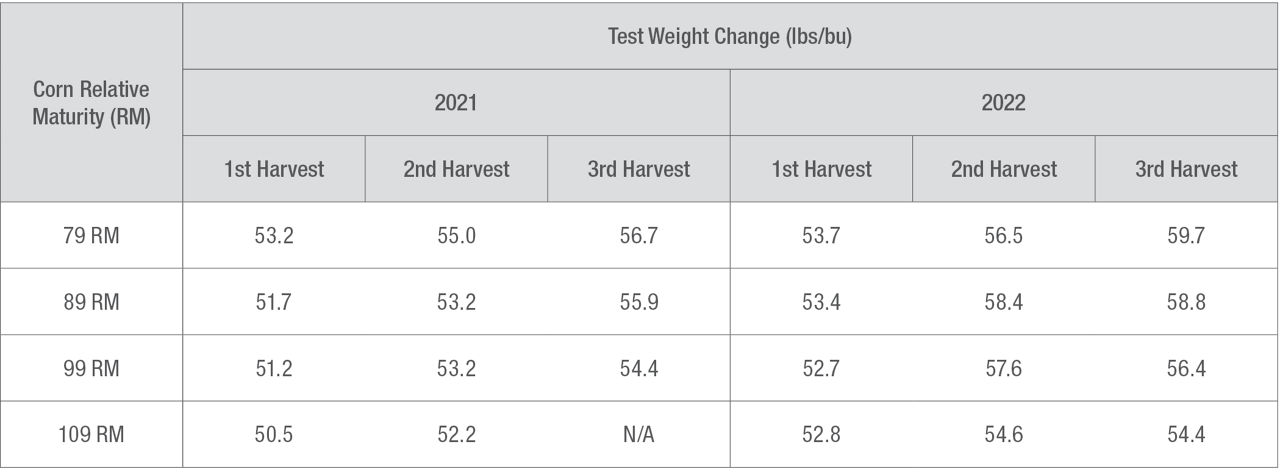
Test Weight
- Following the trend of moisture, 79 and 89 relative maturity (RM) corn products had higher test weights when compared to 99 and 109 RM corn products (Figure 3 and Table 2).
- Like dry down rates, test weights in general were higher in 2022 when compared to 2021.
- A decrease of 1.2 pounds per bushel of test weight was observed on the 99 RM corn products from the second to the third harvest of 2022.
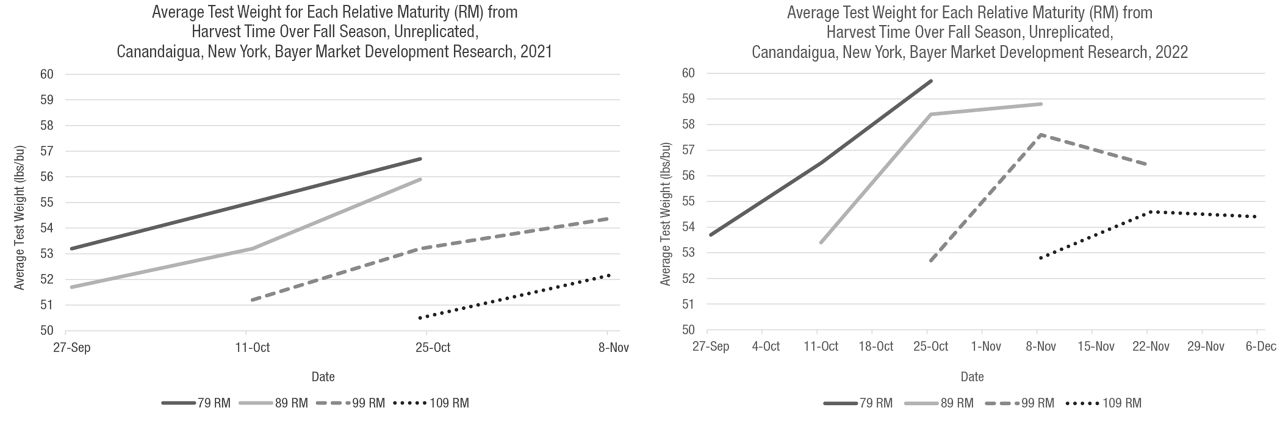
Table 2. Test weight (lbs/bu) for each relative maturity (RM) set at each harvest time for 2021 and 2022.
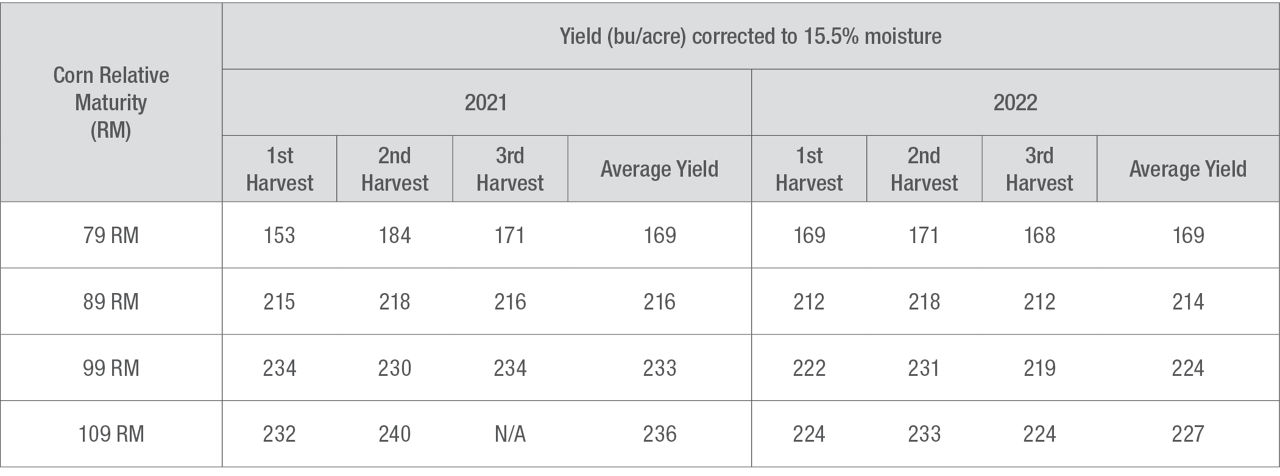
Yield
- Average yields for the 79 and 89 relative maturity (RM) sets were consistent for both years (Table 3).
- Average yields for the 99 and 109 RM corn products were 11 bu/acre higher in 2021 when compared to 2022 (Table 3).
- A 3 bu/acre difference between the 99 and 109 RM sets might suggest that trying later maturities (over 100 RM) might not justify the risk of losing the quality of the crop. Adverse weather such as an early freeze event, windstorm, or snowfall could cause increased harvest and grain drying costs.
- Depending on the region, earlier RM corn products could have a considerable yield reduction with a negative effect on return on investment.
Table 3. Yield (bu/acre) for each relative maturity (RM) set at each harvest time for 2021 and 2022.
KEY LEARNINGS
- Growing seasons vary in planting date, black layer timing, growing degree day accumulation, pest pressure, and weather events. Wide variances in growing seasons affect corn grain dry down rates and changes in test weight.
- This trial will be conducted again next year to accumulate data on another unique growing season.
1210_203251